Archive : Article / Volume 2, Issue 1
- Research Article | DOI:
- https://doi.org/10.58489/2836-6204/006
Analytical Method Development and Validation of Hptlc Method for Simultaneous Estimation of Telmisartan and Azelnidipine in Tablet Dosage Form
1 Assistant Professor at Marwadi University, Rajkot, Gujarat, India
Ashwini Dhruv
Ashwini Dhruv, Analytical Method Development and Validation of Hptlc Method for Simultaneous Estimation of Telmisartan and Azelnidipine in Tablet Dosage Form. Research of Gastric Management and Hepatology.2(1). DOI:10.58489/2836-6204/006
© 2023 Ashwini Dhruv, this is an open access article distributed under the Creative Commons Attribution License, which permits unrestricted use, distribution, and reproduction in any medium, provided the original work is properly cited.
- Received Date: 08-02-2023
- Accepted Date: 16-02-2023
- Published Date: 25-02-2023
blood pressure; hptlc method; telmisartan; azelnidipine
Abstract
Background: A specific, accurate, precise, robust and cost effective HPTLC method was developed and validated for quantitative analysis of Telmisartan and Azelnidipine in fixed dose combination. The separation was carried out on pre-coated TLC plates with Silica gel 60 F254 as stationary phase using Chloroform: Ethyl acetate: Methanol (7.5:2:0.5 v/v/v) as developing system followed by densitometry measurement of bands at 280nm.
Result: The separation of Telmisartan and Azelnidipine was found to be at the following RF values 0.3 and 0.63 respectively. Calibration curves were found to be linear over the concentration ranges 400-4000ng/band, 80-800ng/band for Telmisartan and Azelnidipine with correlation coefficient 0.9957 and 0.9966 respectively. Accuracy was found between 98.03% - 102% and 98.72% - 102 % for Telmisartan and Azelnidipine respectively. LOD was found to be 1.04% and 1.6% and LOQ was found to be 3.49% and 5.57% for Telmisartan and Azelnidipine respectively
Conclusion: The results showed that the proposed HPTLC method is reliable for routine analysis for simultaneous determination of Telmisartan and Azelnidipine without any interference.
Introduction
Hypertension is defined as a sustained increase in blood pressure ≥140/90 mm Hg, a criterion where risk of hypertension-related cardiovascular disease is high enough to merit medical attention. Blood pressure is the lateral pressure exerted by blood on the wall of the blood vessel while flowing through it. It’s produced due to cardiac output and peripheral resistance. [1]
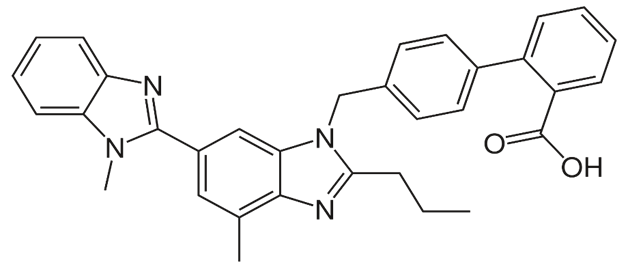
Telmisartan is chemically 2- [4- [[4-methyl-6-(1-methylbenzimidazol-2- yl)- 2- propyl benzimidazol-1- yl] methyl] phenyl] benzoic acid. Telmisartan is an Angiotensin II Type-I receptor (AT1) Blocker. Reported data suggests that Telmisartan is Sparingly soluble in methanol, slightly soluble in water. Telmisartan was rapidly absorbed by oral administration. Excretion was found to be by biliary excretion in the urine 0.91 % and 0.49 % of total radioactivity.[2] The structure of Telmisartan is given in Figure 1.
Azelnidipine is chemically 3-(1-Benzhydrylazetidin-3-yl) 5-isopropyl 2- amino-6-methyl-4-(3-nitrophenyl)-1,4- dihydropyridine-3,5-dicarboxylate. Reported solubility was found to be in ethanol and acetic acid. Azelnidipine acts by inhibiting trans-membrane Ca+2 channel of smooth muscle in vascular muscles in vascular walls, induces smooth muscle contraction, contributing to hypertension. Azelnidipine was found to be absorbed with a Tmax of 3 h. After multiple Doses, the Tmax is about 21 hours. Azelnidipine is metabolized by hepatic cytochrome P450 (CYP) 3A4 and excreted by Feces (80%) and Urine (20%). The structure of Azelnidipine is given in Figure 2.[4]

A review of literature reveals that various analytical methods are available for estimation of individual drugs. It includes UV spectrophotometry [6-8], HPLC [9-10], RP-HPLC [14-16], stability indicating HPTLC [17-18]. Based on literature survey it was found that there was no any simple and HPTLC method available for the simultaneous estimation of Telmisartan and Azelnidipine in fixed-dose combination.
Methods
Material and Instrumentation:
Telmisartan and Azelnidipine were procured from Precise Chemipharma Pvt Ltd, Mumbai, Maharashtra. HPLC grade Methanol, Acetonitrile and Loba Chemie Water were used. All other chemicals were analytical reagent grade. Chromatographic analysis was carried out using Camag HPTLC instrument using CAMAG vision CATS software for data acquisition.
Chromatographic condition:
The Chloroform: Ethyl acetate: Methanol in the ratio of (7.5:2:0.5 v/v/v) were used as mobile phase. Development was done through twin trough chamber previously saturated with mobile phase. The saturation time was 15 minutes. Migration distance was 80 mm and detection were carried out at 280 nm.
Preparation of standard stock solution:
A standard stock solution for Telmisartan and Azelnidipine of 1000 μg/ml was prepared using methanol as a diluent.
Preparation of Working solution of the mixture of Telmisartan and Azelnidipine:
A working solution of 400 μg/ml of Telmisartan and 80 μg/ml of Azelnidipine were prepared by appropriate dilution.
Calibration standards:
The calibration curve was plotted over a range of 80 to 800ng/band and 400 to 4000ng/band for AZE and TEL respectively. 1,2,4,6,8,10 µl of standard stock solution was applied to each band on TLC plate using Hamilton Syringe by ATS 4 applicator at 280 nm.
Method Validation:
Analytical Validation Parameters for the analysis of the proposed method were determined according to ICH Q2 guideline. The parameters such as linearity, range, accuracy, precision and specificity, robustness, LOD and LOQ were performed.
Linearity:
The linearity response of Telmisartan and Azelnidipine was determined by analyzing six independent level of calibration curve at concentration range of 400-4000ng/band &80-800ng/band respectively. For each drug a series of standard solutions were applied on the same plate as separate spots, densitograms were developed under optimized chromatographic conditions and analyzed at 280nm.calibration graphs were plotted by taking peak area (y axis) against the corresponding amount of the drug (x axis).
Accuracy and Precision:
The accuracy of the method was performed in triplicate at three different concentration levels of 50, 100 and 150% of the targeted concentrations of the drugs. The accuracy of the method was evaluated by calculating percentage recovery.
Repeatability was performed under 6 replicates at the assay concentration of TEL and AZE. Intraday and Inter day variations TEL and AZE were performed in triplicate at three different concentration levels of 50, 100 and 150%. Results are expressed in form of RSD.
Specificity:
Comparison of standard and sample solution of TEL and AZE was used for determination specificity of the method. The sample confirmation was performed by comparing the Rf values and spectra of the sample with the reference standard.
LOD and LOQ:
The limit of detection (LOD) and limit of Quantitation were calculated as per formula given in ICH Q2 (R1) guideline.
LOD= 3.3 x Standard deviation/ Slope
LOQ= 10 x Standard deviation/ Slope
Robustness
The robustness of the method was established by introducing small deliberate change in experimental conditions like flow rate, pH of mobile phase, and mobile phase composition. For robustness analysis, experiments were done in triplicate.
Results
Optimized Condition for method development
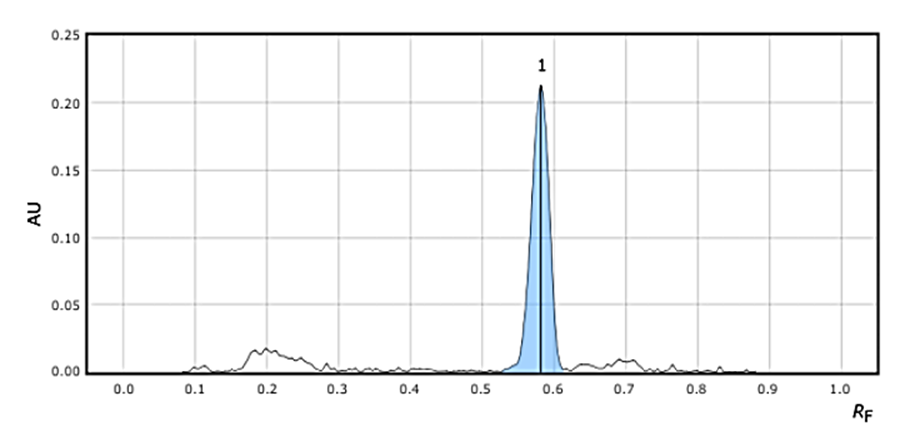
After investing through various mobile phase concentrations, the best retention factor was achieved on Silica Gel 60 F254 plate with mobile phase composition of Chloroform: ethyl acetate: methanol (7.5:2:0.5 v/v/v) as diluent. The detection wavelength was 280 nm. The retention factor obtained of Telmisartan and Azelnidipine were obtained as 0.3 and 0.65 respectively. The >optimized chromatogram and optimized conditions are mentioned in Figure 3 and Table 1.
Parameters | Chromatographic conditions: |
Stationary phase | Silica Gel 60F254 |
Mobile phase | Chloroform: ethyl acetate: methanol (7.5:2:0.5 v/v/v) |
Saturation time | 15 minutes |
Development Chamber | Camag twin trough chamber previously saturated with mobile phase |
Detection wavelength | 280 nm |
Diluent | Methanol |
Migration Distance | 80 nm |
Temperature | Room Temperature |
Table 1: Optimized Chromatographic conditions


Method Validation
Linearity:
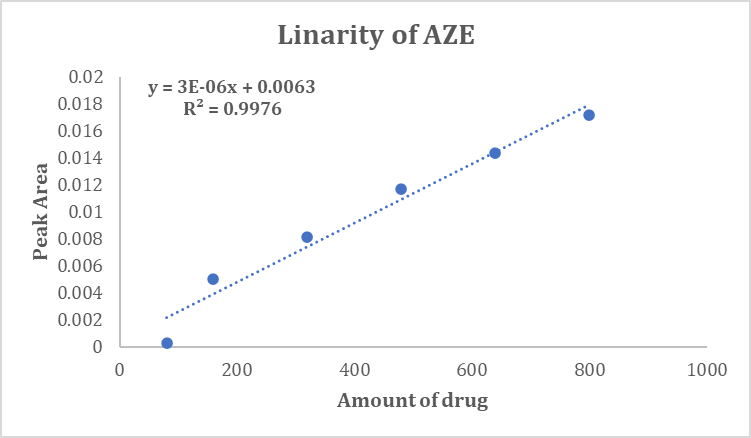
The calibration curve of TEL & AZE was found to be in the concentration range of 400 to 4000 ng/band and 80 to 800 ng/band respectively with co-relation coefficient of 0.9957 and 0.99666 respectively. Linearity graphs are indicated in Figure 4, Figure 5 and Table 2.
Concentration (ng/band) | Peak Area |
400 | 0.00776 |
800 | 0.00896 |
1600 | 0.01161 |
2400 | 0.015 |
3200 | 0.01717 |
4000 | 0.01996 |
Table 2: Linearity data for TEL

Concentration (ng/band) | Peak Area |
80 | 0.00029 |
160 | 0.00501 |
320 | 0.0081 |
480 | 0.01167 |
640 | 0.01436 |
800 | 0.01715 |
Table 3: Linearity data for AZE
Accuracy:
The developed HPTLC method was found to be accurate as %Recovery was found in the range of 98.03%, to102% for TEL and 98.72% to 102 % for AZE are mentioned in Table 3 & 4.
Level | Conc. of sample taken (ng/band) | Conc. Of pure API Spiked (ng/band) | Total conc. (ng/band) | Mean total conc. (ng/band) | % Recovery | Mean % Recovery |
50 | 1600 | 800 | 2400 | 2444 | 101.8 | 101.9 |
2433 | 101.3 | |||||
2463 | 102.6 | |||||
100 | 1600 | 1600 | 3200 | 3292 | 102.8 | 102.0333 |
3289 | 102.7 | |||||
3223 | 100.6 | |||||
150 | 1600 | 2400 | 4000 | 3884 | 97.1 | 98.3 |
3927 | 98.1 | |||||
3989 | 99.7 |
Table:3 Accuracy data for TEL.
Level | Conc. of sample taken (ng/band) | Conc. Of pure API Spiked (ng/band) | Total conc. (ng/band) | Mean total conc. (ng/band) | % Recovery | Mean % Recovery |
50 | 320 | 160 | 480 | 495.7 | 103.2 | 101.1 |
475.5 | 99 | |||||
485.5 | 101.1 | |||||
100 | 320 | 320 | 640 | 652.3 | 101 | 102.6667 |
659.3 | 103 | |||||
666.1 | 104 | |||||
150 | 320 | 480 | 800 | 797.3 | 99.66 | 98.72333 |
791.2 | 98.9 | |||||
780.9 | 97.61 |
Table:4 Accuracy data for AZE.
Precision:
Repeatability and intermediate precision are expressed in terms of RSD. The RSD was found to be <2> Sr no. Concentration (ng/band) Area TEL AZE TEL AZE 1 1600 320 0.01123 0.0079 2 1600 320 0.01163 0.0081 3 1600 320 0.0115 0.00812 4 1600 320 0.01137 0.0081 5 1600 320 0.01165 0.0083 6 1600 320 0.01158 0.00811 MEAN 0.0115 0.0081 SD 0.0002 0.0001 % RSD 1.4314 1.5641
Table 5: Repeatability data of TEL & AZE
Time | Concentration (ng/band) | Area | ||
TEL | AZE | TEL | AZE | |
Morning | 1600 | 320 | 0.01168 | 0.00815 |
Afternoon | 1600 | 320 | 0.01178 | 0.00845 |
Evening | 1600 | 320 | 0.01198 | 0.00824 |
MEAN | 0.0118 | 0.0083 | ||
SD | 0.0002 | 0.0002 | ||
% RSD | 1.2931 | 1.8593 | ||
Table 6: Intraday Precision data of TEL & AZE
Day | Concentration (ng/band) | Area | ||
TEL | AZE | TEL | AZE | |
Day 1 | 1600 | 320 | 0.01167 | 0.00812 |
Day 2 | 1600 | 320 | 0.01197 | 0.00809 |
Day 3 | 1600 | 320 | 0.01155 | 0.00814 |
MEAN | 0.0117 | 0.0081 | ||
SD | 0.0002 | 0.0003 | ||
% RSD | 1.8443 | 0.3101 | ||
Table 7: Interday Precision data of TEL & AZE
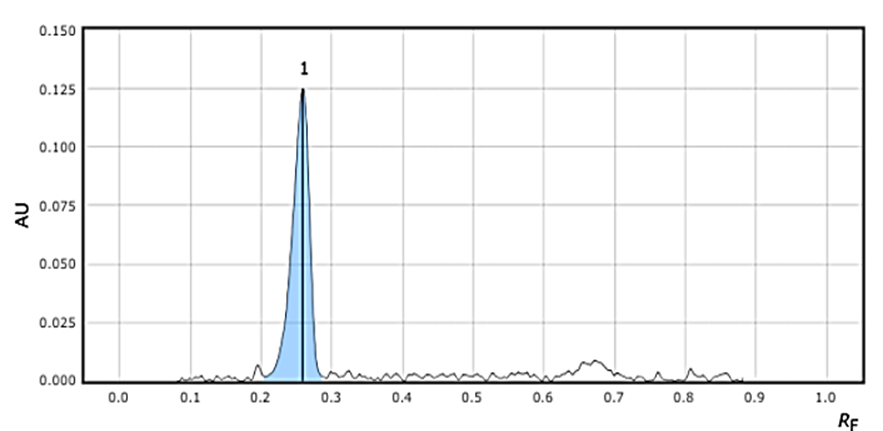
Specificity:
Excipients interference was not observed at working wavelength of 280 nm, as % interference was found to be less than 0.6% in both the drugs. The HPTLC chromatogram of both the drugs is mentioned in Figure 6 &7 of TEL and AZE respectively.
LOD and LOQ:
LOD and LOQ were found to be 1.04 ng/ml and 3.49 ng/ml for TEL and 1.6 ng/ml and 5.57 ng/ml respectively.
Robustness:
Small but deliberate change was done in experimental parameters. The % RSD was found to be less than 2% as specify that the method is robust. Results are presented in Table 8 & 9 indicated that the selected factors remained unaffected by a small variation of these parameters.
Parameters | Normal condition | Changed condition-1 | Changed condition-2 |
Mobile phase | Chloroform: Ethyl acetate: methanol (7.5:2:0.5 v/v/v) | Chloroform: Ethyl acetate: methanol (7.8:1.7:0.5 v/v/v) | Chloroform: Ethyl acetate: methanol (7.2:2.3:0.5 v/v/v) |
Area | 0.01168 | 0.0119 | 0.01355 |
0.01178 | 0.01192 | 0.01333 | |
0.01198 | 0.01173 | 0.0132 | |
Average | 0.01181 | 0.01185 | 0.01336 |
SD | 0.000153 | 0.0001 | 0.00018 |
% RSD | 1.29 | 0.881 | 1.32 |
Saturation time | 15 minutes | 12 minutes | 18 minutes |
Area | 0.01168 | 0.00139 | 0.00119 |
0.01178 | 0.00136 | 0.00117 | |
0.01198 | 0.00138 | 0.00119 | |
Average | 0.01181 | 0.001377 | 0.0011 |
SD | 0.000153 | 0.00002 | 0.00001 |
% RSD | 1.29 | 1.1 | 0.975 |
Table 8: Robustness data for TEL
Parameters | Normal condition | Changed condition-1 | Changed condition-2 |
Mobile phase | Chloroform: Ethyl acetate: methanol (7.5:2:0.5 v/v/v) | Chloroform: Ethyl acetate: methanol (7.8:1.7:0.5 v/v/v) | Chloroform: Ethyl acetate: methanol (7.2:2.3:0.5 v/v/v) |
Area | 0.00815 | 0.00587 | 0.00509 |
0.0084 | 0.00587 | 0.00514 | |
0.00824 | 0.00582 | 0.0052 | |
Average | 0.00826 | 0.005853 | 0.0051 |
SD | 0.000127 | 0.00003 | 0.00006 |
% RSD | 1.5 | 0.493 | 1.07 |
Saturation time | 15 minutes | 12 minutes | 18 minutes |
Area | 0.00815 | 0.0055 | 0.0062 |
0.0084 | 0.0056 | 0.00638 | |
0.00824 | 0.0056 | 0.00632 | |
Average | 0.00826 | 0.0055 | 0.0063 |
SD | 0.000127 | 0.00006 | 0.00009 |
% RSD | 1.5 | 1.03 | 1.45 |
Table 9: Robustness data for AZE
Conclusion
A simple rapid HPTLC method was developed for simultaneous estimation of Telmisartan and Azelnidipine in tablet dosage form, which provides sufficient resolution between both the drugs. The developed method was validated by testing its linearity, precision, accuracy, LOD, LOQ and robustness and results were found within the acceptance criteria as per ICH Q2 (R1) guideline. the Statistical analysis has proven that the developed method is suitable for simultaneous estimation of both the drugs in pharmaceutical analysis and routine analysis without any interference.
References
- Tortora GJ. and Grabowski SR (2013) Principles of anatomy and physiology 10th Edn;John Wiley & Sons, New jersey, pp 758-759.
- Drug profile of Telmisartan, https://pubchem.ncbi.nlm.nih.gov/compound/Telmisartan, Accessed on June 2022.
- Structure of Telmisartan, https://en.wikipedia.org/wiki/Telmisartan, Accessed on June 2022.
- Drug profile of Azelnidipine, https://pubchem.ncbi.nlm.nih.gov/compound/Azelnidipine, Accessed on June 2022
- Structure of Azelnidipine, https://en.wikipedia.org/wiki/Azelnidipine, Accessed on June 2022.
- Pradhan KK, Mishra US, Saho A (2011) Method Development and Validation of Telmisartan In Bulk and Pharmaceutical Dosage Forms by UV Spectrophotometric method. International Journal of Research in Pharmaceutical Science 2(4): 526- 530
- Rathod SD, Patil PM, Waghmare SA (2012) UV-Spectrophotometric Method for Estimation of Telmisartan in Bulk and Tablet Dosage Form. International journal of Pharmaceutical Sciences and Research. 3 (10): 3936-3939.
- Raskapur KD, Patel MM, Captain AD (2012) UV-spectrophotometric method development and validation for determination of Azelnidipine in pharmaceutical dosage form. International Journal of Pharmacy and Pharmaceutical Sciences. 4: 238-240.