Archive : Article / Volume 2, Issue 1
- Research Article | DOI:
- https://doi.org/10.58489/2836-497X/010
Botanical Origin, Physicochemical Composition and Antioxidant Content of Comb, Crushed and Processed Honey Collected from Burie-Ethiopia
1* Food Science and Nutrition Co-author Abera belaye (Phd), Ethiopia.
2 Livestock Development Institute, Ethiopia.
Yeshitla Eshete*
Yeshitla Eshete, Abera Belay (2023), Botanical Origin, Physicochemical Composition and Antioxidant Content of Comb, Crushed and Processed Honey Collected from Burie-Ethiopia, Archives of Gynaecology and Women Health, 2(1): DOI: 10.58489/2836-497X/010
© 2023 Yeshitla Eshete. This is an open-access article distributed under the terms of The Creative Commons Attribution License, which permits unrestricted use, distribution, and reproduction in any medium, provided the original author and source are credited.
- Received Date: 08-03-2023
- Accepted Date: 15-03-2023
- Published Date: 22-03-2023
Antioxidant properties; Comb honey; Crushed honey; Physicochemical properties; Processed honey; Sensory properties
Abstract
Honey quality and authenticity continue to be important factors in honey consumption and marketing. The major concern with honey quality is to keep its natural properties and compositions. This research work is aimed at investigating the botanical origin, physicochemical, antioxidant, rheological, and sensorial quality characteristics of comb, crushed, and processed honey. Accordingly, thirty samples were collected from Burie district of Ethiopia. Based on Melissopalynology, botanical origin was determined. Physicochemical properties were determined based on the standard methods of the International Honey Commission (IHC) and the Association of Official Analytical Chemists (AOAC). Antioxidant properties and diastase activity were determined using UV-visible spectroscopy. All the samples were poly floral honey. Comb honey was found to have moisture (17.98±0.72), sucrose (2.46±0.77), diastase activity (11.78±1.5 DN), total phenol content (TPC) (120.8±47.4 GAE/100gm), total flavonoid content (TFC) (53.7±24 CEQ/100g), 2,2-diphenyl-1-picrylhydrazyl (DPPH) inhibition (30.9±14.9%), IC50 (54±5.72 mg/ml), hydrogen peroxide (H2O2) scavenging (57±16.06%). It was determined that crushed honey contains moisture (19.43±0.40), sucrose (4.21±0.76), diastase activity (9.28±0.25), TPC (84.3±51.86), TFC (29.4±61), DPPH inhibition (33.45±5.07), inhibitory concentration (IC50) (80±6.25), H2O2 scavenging (52.99±15.9). Analysis of processed honey indicated that moisture (23.76±0.78), sucrose (6.12±0.6), diastase activity (7.76±0.71), TPC (66.7±30.59), TFC (29.47±11.22), DPPH inhibition (33.98±1.84), IC50 (120±8.25), H2O2 scavenging
(56.61±4.86). Correlation analysis indicated that moisture associate to sucrose content (r=0.88), diastase activity related to sucrose (r= -0.86), TPC correlates with H2O2 scavenging activity (r=0.82). Honey samples were found to be a Newtonian fluid. The sensory quality of comb honey is preferable. The result revealed that comb honey adequately satisfies the requirements of national and international standards.
Conflict of interest
The authors declare that they have no known competing financial interests or personal relationships that could have appeared to influence the work reported in this paper.
Availability of data and material
The authors declare that data supporting the findings of this study are available within the article [and its supplementary information files].
Authors Contribution
All of the two authors conducted the research. YE and AB designed the research, develop the parameters, analyze the samples, analyze thedata, and wrote the manuscript. All authors read and approved the final version of the manuscript.
Introduction
Honey production is a very long-standing and deep-rooted household activity in Ethiopia. Ethiopia has a huge potential for beekeeping, because it is endowed with diversified honey flora and suitable topography [1]. The apiculture sector has a significant role in generating and diversifying the incomes of smallholder beekeepers [2]. It has been contributing to the national economy through export earnings. Ethiopian honey production is characterized mainly by traditional, backyard, forest beekeeping [3]. In Ethiopia, 6,986,100 bee colonies were found in beehives, of which 95.87% were found in traditional, 2.66% in frame and 1.47 in transitional beehives [4]. Besides, about 1.4–1.7 million households are engaged in beekeeping, which produces and markets, mainly, crushed and comb honey. Ethiopian honey varies in color, consistency, and purity depending on geographical location, botanical origin, and harvest season [5].
Ethiopian honey is mainly sold as comb, crushed, and processed. The widespread fraud practices and quality limitations of honey have exerted a negative effect on the use and trust of different types of honey not only in the study area but also worldwide. According to [6], honey is a natural product having varied physicochemical properties and compositional variations. The geographical locations, the botanical origins, and pre-and post-harvest handlings are the factors of variation. The physicochemical properties of honey can be changed during post-harvest handling, processing, and storage practices. The marketing of comb and crushed honey was also experienced in Africa and some other continents. Evaluating and measuring the botanical origins, physicochemical, antioxidant, rheological, and sensory attributes of comb, crushed, and commercially processed honey for wider communication is fundamentally important to encourage quality product marketing and enhance honey industry development. This will, of course, contribute further to the protection of domestic consumers, promote fair competition among producers, and improve the foreign currency earnings from honey exports.
Ripe honey in the beehives is qualified enough for human consumption and can be used for industrial purposes. Honey is one of the most functional foods due to its unique nutritional and medicinal properties, which are attributed to the influence of the different groups of substances it contains [7]. The Codex Alimentarius Commission [8] and other international honey standards stipulate that honey must only comprise honey and that no specific component may be eliminated. Organoleptic characteristics, physicochemical analyses, bio-functional characteristics, and pollen spectrum are now the primary grading criteria for honey [9]. Because of the multiple importance of honey, from food to medicine, it is of great interest to carry out a complete analysis and measurement of honey [10]. The composite nature of honey makes it vulnerable to adulteration. It is testing and verification has been challenging due to the similarity in the composition of adulterants [11]. On the other hand, Bogdanov et al.
[12] stated that there was a growing need to assess the quality and authenticity of honey, particularly with regard to quality, geographical and botanical origins. Domestic consumers can learn to trust and feel confident utilizing comb honey rather than processed and smashed honey claims [13]. As a result, it was explained why there has been an increase in the demand for comb honey. For this reason, beekeepers in and around the study area were experienced in managing comb honey market supplies. Beyond this, Belay et al.
[14], and Debela & Belay [15], and other reports were conducted to investigate honey in different parts of Ethiopia. However, no research has been done on the physicochemical, antioxidant, sensory, and rheological properties of comb, crushed, and processed honey from the Burie district. Therefore, the objective of this research is to measure and evaluate the quality merit of comb, crushed, and processed honey using various tools.
Materials and Methods
Sample collection and preparation
Representative comb honey samples were randomly selected from three honey production potential peasant associations (Shekua, Weynima and Tiyatiya), and crushed and processed honey samples were also collected from the local market of Burie district, West Gojam, Ethiopia (Figure 1). The geographical coordination of the district is found at X-Y GPS coordination of 1180000 N. 300000 E.
The representative honey samples were collected randomly during the second main honey flow season in the study area (15th of July – the 20th of August 2021). The honey samples were collected and handled based on the principles used by Belay et al. [14] until laboratory analysis. A total of thirty honey samples were randomly collected, ten from each (combs, crushed and processed).
Laboratory Analysis
Botanical origin
Botanical origin was determined based on Belay et al. [14], using pollen analysis. Accordingly, 10 g of honey was weighed using a centrifuge tube and dissolved in 20 ml of warm distilled water (20–40 0C). The solution was centrifuged at 2060 g (3500 rpm) for 10 minutes, and the supernatant was decanted. Twenty ml of water was added again to completely dissolve the remaining sugar crystals and centrifuged at 2060 g (3500 rpm) for 5 minutes, and the supernatant was removed. The sediment was spread evenly using a sterile micro spatula on the microscope slide, and to dissolve some fat particles from the pollen grain, a drop of glycerin jelly was added and smeared to the cover slip, and the pollen grains were identified using a pollen atlas [3]. The pollen count was done under a microscope (ZEISS, Germany). The frequency of occurrence was determined by counting 500 pollen grains from a single slide. Then, the pollen counts were converted into percent to calculate the relative dominance.
Physicochemical property
Moisture
Moisture was determined with a digital refractometer (Abbe refractometer, Leica Mark II Plus) thermostated at 20 0C. The honey sample was homogenized and the surface of the prism was covered evenly with the sample. After 2 min, the refractive index was read with a refractometer. The refractive index reading was converted to moisture content using the AOAC, 969.38 conversion table AOAC [16].
Sugars profile
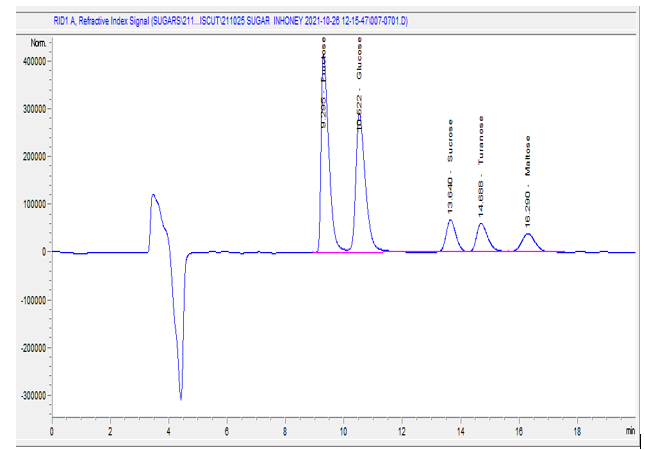
Sugars were determined using high-performance liquid chromatography (HPLC-1260 Infinity Series, Agilent Technologies, Germany) equipped with a differential refractive index (DRI) detector AOAC [16]. Glucose, Fructose, Sucrose, Maltose, and Turanose sugars were determined using high-performance liquid chromatography (HPLC) 1260 Infinity Series Agilent Technologies at an Ethiopian conformity assessment laboratory. The honey sample (5 g) was dissolved in a 25% methanol in water solution, and the solution was transferred and made into a 100 ml volumetric flask. The solution was filtered through a 0.45 μm syringe and injected into the HPLC. The separation was performed using an NH2 column (4.6 × 250 mm) (ZORBAX NH2) with a particle size diameter of 5 μm, and the column was kept at 30 0C. The mobile phase composition was 70
Antioxidant properties
Total phenolic content
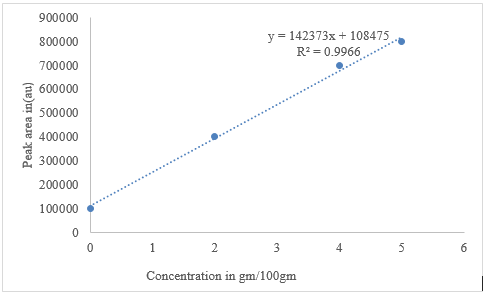
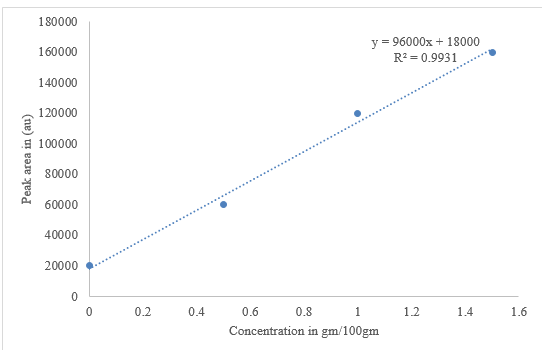
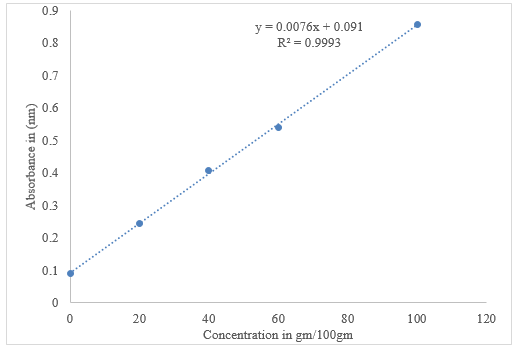
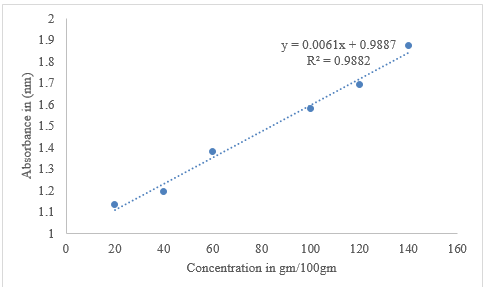
The total phenolic content in honey was determined using the Folin-Ciocalteu method in an alkaline environment. The Folin-Ciocalteu method, modified by [20], was used to determine total phenolic content in honey. Gallic acid (0–100 mg/ml) was used for calibration. Total phenolic compound content was expressed as mg of Gallic acid equivalent per kg of honey (mg of GAE/gm). Five gm of honey was dissolved in 50 ml of distilled water, shaken and kept in a dark place, vortexed and then filtered using quantitative filter paper 202 moderate 150 mm. One mg of gallic acid with 1 ml of distilled water was dissolved, shaken and dilution (0–100 μg/mL) with a concentration range of (0, 20, 40, 60, and 100) was prepared as a standard to establish the calibration curve, and absorbance was measured at 760 nm.
Total flavonoids content
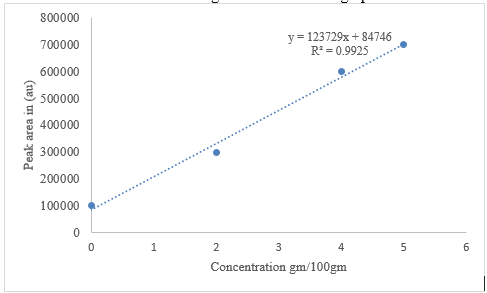
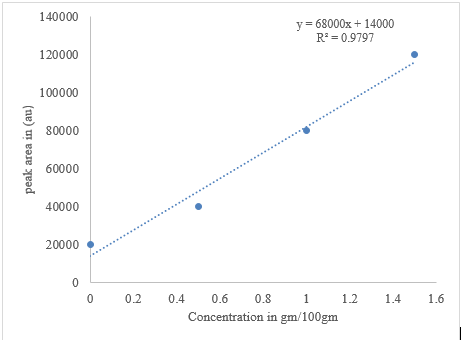
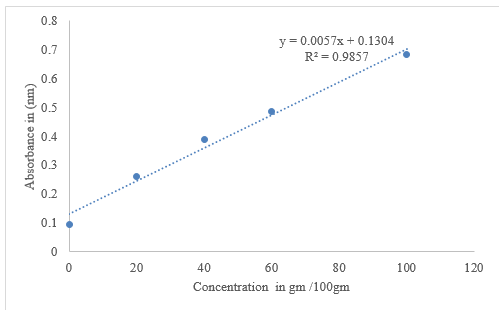
The total flavonoids in honey were determined using a modified photometric method [20]. One gram of quercetin in 1 mL of distilled water was dissolved, shaken, and the stock solution was prepared. To perform different concentrated solutions, a serial dilution of the quercetin standard with a concentration of (0, 20, 40, 60, and 100) was prepared. Absorbance was measured at 510 nm using a UV Visible Spectrophotometer (JENWAY 6300). The total flavonoid contents of the honey samples were determined using AlCl3 according to Wieczorek et al. [21]. Quercetin was used as a standard to establish the calibration curve. A standard curve of quercetin was prepared within a concentration range of 20-100 μg/ml and the results were expressed as mg of quercetin per kg of honey (mg of QE/kg).
Radical scavenging activity
Radical scavenging activities were determined using Meda et al., [22]. Honey samples were dissolved in distilled water at concentrations of ascorbic acid ranging from 20–140 g/ml and were mixed with 4 ml of 0.004% DPPH. A pure L-ascorbic acid standard was used as a reference. The mixtures were shaken vigorously and left for 30 min at room temperature in the dark, and the absorbance of the DPPH was measured at 517 nm against a blank using a UV visible Spectrophotometer (JENWAY 6300).
The radical scavenging activities of DPPH radical, expressed as % inhibition, were calculated from the following equation.
Where Abs blank = blank absorbance at 517 nm; Abs sample = sample absorbance at 517 nm.
Hydrogen peroxide (H2O2) scavenging activity
The hydrogen peroxide scavenging activity was assayed according to the method described by [23]. Accordingly, the samples were dissolved in 0.04 M phosphate buffer (pH = 7.4) and 5 mL of the samples were mixed with 0.6 mL of 40 mM H2O2 solution (prepared in the same buffer). The absorbance of the mixture and hydrogen peroxide was determined at 230 nm using a UV Spectrophotometer (Biochrom 80-7000-30, Cambridge, England). Ascorbic acid was used as a standard, and the blank was prepared in phosphate buffer without H2O2. The decrease in absorbance value showed the high level of hydrogen peroxide scavenging activity designation. The results were expressed as H2O2 SC = micrograms per milliliter. The percentage of scavenged hydrogen peroxide was calculated by using the following equation:
Percentage of scavenging H2O2100
Where Ai = absorbance of control; At= absorbance of test honey
Inhibitory concentration (IC 50)
A substance's ability to inhibit a certain biochemical function by 50% is measured by its IC50 (inhibitory concentration), which is calculated using the technique outlined by Al-Farsi et al. [24]. The dose-response curves created by graphing the percentage of inhibition verse concentration were used to get the IC50 value.
Rheological measurement
The rheological properties of comb, crushed and processed honey samples were measured by the rheometer machine MCR 102 (Anton Paar GmbH, Graz, Austria) with the use of cone-and-plate measuring geometry. The rheometer was adjusted at a temperature range of 20–50 0C and with a constant shear rate of 50s-1. Honey samples were uniformly smeared on the cone and plate of the rheometer. The diameter of the cone is 50 mm at an angle of 10. Measurements were carried out at 20, 30, 40, and 50 0C. The effect of temperature on the apparent viscosity of honey was analyzed and graphic curves were evaluated. After a complete set of readings for each sample, the cone and plate bearing and stirring rod were washed with tap water, rinsed, and allowed to dry before the next sample was applied.
Sensory profile
For sensory analysis, ISO 13299: [25] was used. The test room has been arranged to conform to ISO 8589 (1988) minimum requirements (lighting, temperature, noise, odors). The assessors were selected based on detection, recognition, and the ability to memorize and communicate sensory impressions. Twenty-three (twenty-two female and eleven male) panelists were selected and trained by the panel leader following international standards [26]. Instructions were also given on how to smell or taste, rinse the mouth between samples, and dissolve the sample in the mouth. The required materials for sensory analysis and evaluation forms were prepared. The trained assessors identified the sensory stimuli on the basis of previously memorized standards (ISO, 8586-1, 1993; ISO, 8586-2). The samples were prepared and given a random three-digit code; about 30 (thirty) g of the sample from comb, crushed, and processed honey were put into clean, dry, and free of odor and flavor sampling beakers and served in a single tray for each assessor, Piana et al. [27], established by the International Honey Commission. The samples were tested by 33 assessors and measured using a 1-to-7-line score.
Results and Discussion
Botanical origin
The relative frequency of nectar source plants of honey samples is presented in Table 1. The honey samples collected from the Burie district were found with a variety of nectar distributions. Table 1 shows the comparative pollen distribution of honey samples from Eucalyptus species of comb (31±1.70), crushed (43.7±3.86) and processed (33.5±1.72); as well as Croton macrostachyus of comb (31±3.30), crushed (44.1±3.38) and processed (42±3.83).Trifolium decorum, Plantago lanceolata, Cyperus longusus, Vicia faba, and Coffea arabica were relatively identified in a small proportion (Table 1). The floral origin helps to provide specific information on the color, taste, aroma, chemical compositions, sensorial, and viscosity behavior of honey [12]. Identification and documentation of nectar and pollen source plants are the most limiting factors in the development of the apiculture industry of Ethiopia [28]. Based on the relative frequency of the pollen taxonomy, honey is considered mono floral if the dominance is more than 45% [14, 15]. Accordingly, the honey samples collected from Burie were polyfloral. A description of botanical origin is useful to authenticate and register honey for a protected designation of origin (PDO) that helps to promote specific plant origin honey. At present, consumers and international buyers are demanding branded honey based on botanical origin and geographical indication. To guarantee quality and authenticity, a European Union (EU) council directive [29] states that the botanical origin of honey shall be declared on the label.
Table S1. Botanical origin /pollen analysis of comb, crushed and processed honey sample
Honey sample | Euculayptus species | Croton macrostachys | Trifolium decorum | Cyperus longusus | Vicia faba | Plantago lanceolata | Coffea arabica |
|---|---|---|---|---|---|---|---|
Comb1 | 30 | 35 | 14 | 5 | 7 | 0 | 9 |
Comb 2 | 32 | 27 | 16 | 10 | 0 | 16 | 0 |
Comb 3 | 31 | 36 | 13 | 7 | 5 | 12 | 8 |
Comb 4 | 30 | 28 | 17 | 9 | 6 | 13 | 7 |
Comb 5 | 33 | 26 | 15 | 8 | 3 | 14 | 1 |
Comb 6 | 34 | 30 | 16 | 5 | 4 | 8 | 5 |
Comb 7 | 29 | 33 | 14 | 10 | 3 | 5 | 2 |
Comb 8 | 32 | 32 | 13 | 7 | 2 | 3 | 3 |
Comb 9 | 30 | 31 | 15 | 8 | 3 | 4 | 6 |
Comb 10 | 29 | 32 | 17 | 6 | 2 | 5 | 4 |
Crushed 1 | 52 | 38 | 5 | 0 | 5 | 0 | 0 |
Crushed 2 | 40 | 55 | 0 | 3 | 2 | 0 | 0 |
Crushed 3 | 50 | 42 | 4 | 1 | 5 | 0 | 0 |
Crushed 4 | 48 | 54 | 3 | 2 | 4 | 0 | 0 |
Crushed 5 | 51 | 44 | 2 | 3 | 2 | 0 | 0 |
Crushed 6 | 52 | 43 | 1 | 2 | 3 | 0 | 0 |
Crushed 7 | 42 | 46 | 0 | 0 | 5 | 0 | 0 |
Crushed 8 | 40 | 51 | 6 | 1 | 4 | 0 | 0 |
Crushed 9 | 42 | 50 | 3 | 2 | 3 | 0 | 0 |
Crushed 10 | 43 | 42 | 1 | 1 | 2 | 0 | 0 |
Processed 1 | 32 | 37 | 5 | 11 | 10 | 0 | 5 |
Processed 2 | 35 | 47 | 10 | 0 | 8 | 0 | 0 |
Processed 3 | 36 | 36 | 5 | 10 | 9 | 0 | 4 |
Processed 4 | 34 | 38 | 8 | 7 | 10 | 0 | 5 |
Processed 5 | 35 | 44 | 10 | 11 | 8 | 0 | 0 |
Processed 6 | 32 | 45 | 8 | 5 | 10 | 0 | 2 |
Processed 7 | 31 | 46 | 7 | 6 | 8 | 0 | 2 |
Processed 8 | 33 | 42 | 5 | 0 | 9 | 0 | 4 |
Processed 9 | 32 | 42 | 6 | 2 | 10 | 0 | 3 |
Processed 10 | 35 | 43 | 11 | 3 | 8 | 0 | 0 |
Physicochemical analysis
Moisture
The mean ± SD of moisture content for comb, crushed and processed honey was 17.98±0.72, 19.43±0.40 and 23.76±0.78g/100g, respectively (Table 2). There was a significant difference (p<0>Schefflera abyssinica and 18.90 ± 0.45 g/100gm for polyfloral honey from Ethiopia) [30]. In addition, the findings of this study were in line with the literature values reported by [31] (18.6–18.8g/100g), and [32] (17.5–23 g/100g). The significant difference in moisture content between honey samples may occur due to the maturation of honeycombs during harvesting and post-harvest handling practices. The amount of water present in honey determines its stability against fermentation and granulation [29]. Moisture content is related to the process by which the bees synthesize honey, the harvesting and extraction techniques, and economic adulteration, and can vary from season to season [Kumar et al., [33] and Belay et al., [31]. The Codex Alimentarius established a limit of 20 g/100 g of honey as per the Codex Alimentarius [8].
Sugar profile
Sugar compositions are important quality aspects for energy value, viscosity, hygroscopicity, and granulation of honey. The results of sugars, namely fructose, glucose, sucrose, maltose, and turanose, are presented in (Table 2). The HPLC chromatogram retention times for the sugar profiles of the analyzed honey samples were 9.29 (fructose), 10.22 (glucose), 13.34 (sucrose), 14.68 (turanose), and 16.29 (maltose) minutes. The mean ± SD value of fructose content in the present study was 38.89±0.59, 38.29±1.24 and 36.99±0.51 g/100 g for comb, crushed and processed honey, respectively (Table 2). In the analyzed honey samples, the highest fructose content was identified in comb honey (39.5g/100 g) and the lowest was reported in processed honey (36.5g/100 g). The processed honey significantly varied (p<0>et al. [34], (37.70 ± 1.46 g/100g) for Brazilian polyfloral honey. The mean ± SD value of glucose in the present study is 33.87±1.0, 33.09±1.13 and 33.73±1.22 g/100g for comb, crushed, and processed honey samples, respectively. There is no significant difference (p > 0.05) between honey samples in glucose content. The fructose/glucose ratio (F/G) is also one of the honey quality indicators. In this study, the fructose/glucose ratio falls in the range of 1.10 to 1.20 (comb), 1.13 to 1.21 (crushed), and 1.07 to 1.16 (processed) honey samples. The F/G ratios in all the honey samples of this study were greater than 1.0, which indicates slower crystallization. Honey crystallization is slower when the fructose/glucose ratio is more than 1.3 and it is faster when the ratio is below 1.0. The mean ± SD value of the sucrose content of the analyzed honey samples was found to be 2.46 ±0.77, 4.21 ±0.76 and 6.12±0.6g/100g for comb, crushed, and processed honey samples, respectively (Table 2). The Codex Alimentarius, European Union, and Ethiopian standard allow a maximum sucrose content of 5 g/100 g in honey. The results of this study show that the sucrose content of comb honey was 2.46 ± 0.77 and crushed honey 4.21±0.7 g/100g and met the requirements of international [8] and national regulatory standards [17]. The sucrose content in processed honey might be affected by the lengthy supply chain between the farm gate and processors. The content of turanose is 0.049±0.014, 0.051±0.025 and 0.068±0.014 g/100 g for comb, crushed, and processed honey samples, respectively. The processed honey was varied (p, 0.05) with a comb and crushed honey. The result of maltose content is 0.15±0.24, 0.14±0.2 and 0.086±0.006 g/100 g of combs, crushed and processed honey samples, respectively. A significant difference was not observed (p > 0.05) between the comb, crushed and processed honey samples.
Table S2. Physicochemical properties of comb, crushed and processed honey sample
| Treatment | Mo | Ash | Elcd | HMF | Spcr | ph | Glu | Fur | Suc | Mal | Tur | Insolu Mat | Acid | Dias |
|---|---|---|---|---|---|---|---|---|---|---|---|---|---|---|
| Comb | 17.50 | 0.30 | 0.65 | 5.5 | -11.50 | 3.80 | 32.00 | 38.50 | 2.5 | 0.08 | 0.07 | 0.14 | 37.80 | 11.18 |
| Comb | 18.00 | 0.25 | 0.57 | 3 | -11.65 | 3.60 | 34.00 | 39.50 | 3 | 0.07 | 0.05 | 0.15 | 38.50 | 13.1 |
| Comb | 16.80 | 0.30 | 0.78 | 6 | -10.33 | 3.65 | 33.50 | 36.80 | 2 | 0.09 | 0.06 | 0.12 | 39.20 | 14.3 |
| Comb | 17.00 | 0.23 | 0.76 | 7 | -10.08 | 3.68 | 34.50 | 39.50 | 3.2 | 0.08 | 0.04 | 0.14 | 36.50 | 11.73 |
| Comb | 18.20 | 0.32 | 0.65 | 3.5 | -10.03 | 3.64 | 35.00 | 39.80 | 2 | 0.07 | 0.06 | 0.17 | 35.65 | 12.95 |
| Comb | 18.00 | 0.40 | 0.65 | 4 | -14.01 | 3.55 | 33.20 | 38.80 | 1.8 | 0.06 | 0.03 | 0.08 | 36.60 | 13.93 |
| Comb | 19.00 | 0.50 | 0.62 | 8 | -12.32 | 3.68 | 33.40 | 38.50 | 2.8 | 0.08 | 0.04 | 0.05 | 38.25 | 11.44 |
| Comb | 18.50 | 0.20 | 0.80 | 10 | 13.01 | 3.62 | 33.10 | 39.00 | 4 | 0.09 | 0.03 | 0.14 | 32.85 | 13.37 |
| Comb | 18.80 | 0.42 | 0.77 | 8.5 | -13.14 | 3.65 | 34.80 | 38.60 | 2 | 0.85 | 0.06 | 0.11 | 34.50 | 14.24 |
| Comb | 18.00 | 0.52 | 0.74 | 5 | -12.03 | 3.85 | 35.20 | 38.90 | 1.5 | 0.08 | 0.05 | 0.16 | 38.60 | 12.36 |
| Crushed | 19.60 | 0.35 | 0.65 | 9.5 | -10.80 | 3.60 | 34.20 | 38.50 | 4.5 | 0.075 | 0.07 | 0.18 | 43.50 | 9.1 |
| Crushed | 19.90 | 0.42 | 0.75 | 8 | -11.05 | 3.46 | 32.80 | 39.10 | 4 | 0.08 | 0.03 | 0.16 | 45.20 | 9.6 |
| Crushed | 18.80 | 0.20 | 0.87 | 11 | -10.33 | 3.63 | 30.50 | 34.90 | 3.8 | 0.09 | 0.03 | 0.22 | 39.53 | 9.3 |
| Crushed | 19.30 | 0.50 | 0.77 | 10.5 | -10.08 | 3.62 | 32.20 | 39.00 | 4.5 | 0.75 | 0.05 | 0.17 | 44.24 | 9.12 |
| Crushed | 19.50 | 0.50 | 0.90 | 7.5 | -10.03 | 3.67 | 34.50 | 39.10 | 5 | 0.08 | 0.03 | 0.27 | 37.67 | 9.67 |
| Crushed | 19.20 | 0.33 | 0.63 | 12 | -14.01 | 3.53 | 33.00 | 38.10 | 5.5 | 0.09 | 0.02 | 0.03 | 47.08 | 9.66 |
| Crushed | 19.10 | 0.55 | 0.91 | 6.5 | -12.32 | 3.64 | 33.40 | 38.80 | 3 | 0.07 | 0.05 | 0.08 | 43.31 | 8.83 |
| Crushed | 20.10 | 0.42 | 0.80 | 7 | 13.01 | 3.64 | 33.10 | 38.30 | 4 | 0.09 | 0.09 | 0.14 | 32.97 | 9.44 |
| Crushed | 19.70 | 0.54 | 0.77 | 8.5 | -13.14 | 3.65 | 33.80 | 38.50 | 3.8 | 0.08 | 0.08 | 0.11 | 44.06 | 9.41 |
| Crushed | 19.10 | 0.58 | 0.94 | 9 | -12.03 | 3.81 | 33.40 | 38.60 | 4 | 0.07 | 0.07 | 0.26 | 39.73 | 9.2 |
| Processed | 24.30 | 0.54 | 0.80 | 25.00 | -8.17 | 3.76 | 33.80 | 38.50 | 5.50 | 0.09 | 0.07 | 0.47 | 36.73 | 8.4 |
| Processed | 22.90 | 0.46 | 0.80 | 15.00 | -7.15 | 3.65 | 35.20 | 39.20 | 6.00 | 0.085 | 0.05 | 0.18 | 38.98 | 7 |
| Processed | 25.40 | 0.49 | 0.73 | 6.90 | -8.34 | 3.64 | 31.80 | 36.40 | 6.50 | 0.075 | 0.05 | 0.12 | 39.56 | 7.9 |
| Processed | 23.50 | 0.40 | 0.86 | 18.00 | -10.23 | 3.66 | 32.70 | 37.10 | 5.80 | 0.08 | 0.06 | 0.43 | 39.72 | 8.56 |
| Processed | 22.60 | 0.38 | 0.80 | 6.80 | -7.49 | 3.68 | 33.00 | 36.50 | 5.00 | 0.095 | 0.07 | 0.06 | 39.36 | 7.85 |
| Processed | 23.90 | 0.30 | 0.80 | 6.70 | -12.42 | 3.63 | 33.00 | 36.80 | 5.60 | 0.08 | 0.07 | 0.06 | 49.92 | 7.65 |
| Processed | 24.20 | 0.42 | 0.71 | 6.50 | -8.40 | 3.62 | 33.50 | 36.20 | 6.80 | 0.09 | 0.09 | 0.24 | 42.37 | 8.35 |
| Processed | 23.80 | 0.37 | 0.76 | 22.00 | -8.24 | 3.82 | 34.40 | 38.10 | 6.70 | 0.086 | 0.08 | 0.01 | 18.86 | 7.65 |
| Processed | 23.60 | 0.70 | 0.76 | 6.20 | -10.04 | 3.66 | 35.90 | 38.30 | 6.90 | 0.095 | 0.08 | 0.22 | 38.61 | 6.85 |
| Processed | 23.40 | 0.96 | 0.80 | 5.85 | -10.04 | 3.65 | 34.00 | 37.80 | 6.40 | 0.09 | 0.09 | 0.49 | 36.72 | 7.45 |
Mo= Moisture, Elcd=Electric conductivity, HMF=Hydroxymethylfurfural, Spcr=Specific rotation, Glu= Glucose, Fur= Fructose, Suc =Sucrose, Mal=Maltose, Tur =Turanose, Insolu mat= Insoluble matter, Acid= Acid
Diastase activity
The mean ± SD of diastase activities of the comb, crushed and processed honey samples of the present study were 11.78 ± 1.57, 9.28 ± 0.259 and 7.76 ± 0.71Schade units (DN) respectively (Table 2). A significant difference (p<0.05) was observed among the honey samples. Diastase activity is important to detect and predict honey age and freshness, storage time, and prolonged processing temperature and overheating of honey, Silva et al., [35]. The present diastase result was in agreement with the reports of Debela and Belay [15], which were 7. 64 ± 0.84 and 12.5 ± 0.55 Schade for Coffee arabica honey and Vernonia amygdalina honey, respectively.
Ash content
The mean ± SD of ash content was 0.32±0.08, 0.48±0.06 and 0.55±0.10 g/100g for comb, crushed and processed honey samples, respectively (Table 2). There was no significant difference (p >0.05) observed in ash content among the honey samples. The ash content in the current study was higher than that reported by Debela and Belay [15], which was 0.28 ± 0.05 g/100g for Coffea arabica and 0.28 ± 0.01 g/100g for vernonia amygdalina honey. However, the present result was also consistent with Tesfaye et al., [36], who reported a 0.1–1.0% ash content of honey samples. The overall percentage of ash content was found to be 0.42±0.015 g/100g, which is below the allowable maximum and thus the honey samples conform to the international regulatory standards set for honey quality. The present study result is also consistent with Silva et al.,[35], who reported 0.1–1.0% ash content of Ethiopian honey and is in line with the report of Erturk et al., [37], who reported (0.33 g/100g) for monofloral and (0.42 g/100g) for polyfloral honey. The comb, crushed and processed honeys of this report met the standards set by the Codex Alimentarius [8] and Ethiopian Standard [17], (not more than 0.60 g/100 g) in ash content.
Electric conductivity
The mean ± SD of electrical conductivity for comb, crushed and processed honey of this finding was 0.70±0.08, 0.8± 0.1 and 0.88±0.04 mS/cm, respectively. The electrical conductivity of honey in this study was within the recommendation of Codex Alimentarius and Ethiopian standards (not more than 0.8 mS/cm) [8, 17], comb, crushed, and processed honey samples were identified as nectarous honey. The electrical conductivity of all the studied honey samples was in line with the report of Gebru et al., [38], (0.25–0.41 mS/cm) and [39] (0.41-0.72 mS/cm). The measurement of electric conductivity depends on the ash and acid content of honey: the higher their content, the higher the resulting conductivity. The highest electrical conductivity value was observed in crushed and processed honey samples. The observed significant variations in electrical conductivity may be due to the possible variation in the degree of maturity of honey, post-harvest handling practices, botanical origin, and soil type. The current finding is in good agreement with the results of Eyobel et al., [34], who reported 0.55 ± 0.08 mS/cm. Moreover, the study result is nearly similar to that reported by Belay et al. [31], who reported a mean of 0.70 ± 0.04 mS/cm for honey from the Bale Harenna forest of Ethiopia.
Free acidity
The mean ± SD level of free acidity in the present study is 36.85±2.04, 41.73±4.22 and 38.08±7.74 meq/kg for comb, crushed and processed honey samples, respectively (Table 2). The acidity level of the crushed honey sample exceeded the acidity limit set by national standards (40 meq/kg) ES [17]. Such results indicate the presence of unwanted experiences like the age of honey samples and the occurrence of fermentation. However, the overall findings of this study indicate an acceptable range for Codex and EU Directive [8], which is ≤50 meq/kg. Besides, Belay et al. [14], reported that the free acid content of the Harenna forest honeys of Ethiopia ranged from 25.49 to 48.81meq/kg, which is in agreement with the present study range (36.85 to 41.73meq/kg).
Specific rotation
The mean ± SD of the specific rotation of comb, crushed and processed honey samples is -9.81±8.05, 9.08±7.88 and-8.51±0.81[α] D20), respectively. There was a significant difference (p<0>Coffea arabica and -5.98 ± 0.07 ([α] D20) for Vernonia amygdalina honey. The highest negative value was revealed by comb honey (-9.8), with a mean value of -8.8 ([α] D20). Nectar honey contains a predominance of fructose that results in a negative specific rotation.
Hydroxymethyl furfural
The HMF content of comb, crushed and processed honey was 6.05± 2.3, 8.9±1.8 and 11.8±1.5mg/kg respectively (Table 2). The Hydroxymethylfurfural (HMF) content of honey is used as an indicator of heating temperature and/or prolonged storage and it is recognized as an indicator of honey freshness. The findings of this study were under the requirements of the international Codex [8] and national ES [17], honey quality standards which set maximum of 40 mg/kg. There was a significant difference (p<0.05) in HMF content among the honey samples. The result of the present study of comb, crushed and processed honey was in agreement with Debela H. and Belay A. [15], reported 6.12 ± 2.14 mg/kg for Schefflera abyssinica and 4.37 ± 1.83 mg/kg for polyfloral honey of Ethiopia. Schievano et al., [42] reported an HMF value of 26.2 mg/kg for Coffea arabica honey, which was higher than in the current study.
Water insoluble matter
The mean ± SD of water insoluble matter of the present study for comb, crushed and processed honey samples was 0.13±0.04, 0.16±0.08 and 0.23±0.18 g/kg, respectively. The result of the present study of insoluble matter to combs, crushed and processed honey samples were found to be more than the permitted value by Codex [8], 0.1g/100g. The measurement of insoluble matter is an important means to detect impurities in honey. The mean water insoluble matter content of processed honey samples was significantly higher than that of comb and crushed honey samples. The variation may be due to differences in harvesting practice, processing and storage conditions. The probable water-insoluble solids in honey include wax, pollen, propolis, and other particles of debris.
Antioxidant content
Total phenolic content (TPC)
The mean ± SD of total phenolic content for comb, crushed and processed honey samples was 120.8 ±47.4, 84.3±51.86 and 66.7±30.59 GAE/100g, respectively (Table 2), and a significant difference (p<0>et al., [39], for the phenolic content of monofloral honey (66.45 ±15.4) and polyfloral honey (59.37±13.3 mg GAE/100g). The phenolic content of the present study was in line with the report of Alisi et al. [40] (106 to 130 mg GAE/100g) for Nigerian honey.
Total flavonoid content (TFC)
The mean ±SD values of flavonoid content are 53.7±24, 29.46 ± 14, and 29.47±11.22 CEQ/100g for comb, crushed, and processed honey samples, respectively. There was a significant difference (p<0.05) among the honey samples. The TFC values of the present study were found to be higher at 2–80 mg CEQ/100g of honey. This is in agreement with the report of Debala H. and Belay A. [15], (2.03±1.49 and 31.07±1.31 CEQ/100g) for Schefflera abyssinica and Vernonia amygdalina honey, respectively.
DPPH radical scavenging activity
In this study, the DPPH radical scavenging activity of honey was identified for comb 30.9 ± 14.91, crushed 33.45 ± 5.07 and processed honey 33.98 ± 1.84 % (Table 2). Significant differences (p>0.05) were not observed in DPPH radical scavenging activity among the honey samples. The finding of this study is in line with the report of Hailu and Belay [30], who found 44.43 ± 0.97 for Schefflera abyssinica and 37.93 ± 1.14%, for polyfloral honey from Ethiopia. Moreover, the result of the present study is nearly similar to the report of Goslinski et al. [41], 40.0 ± 0.3% DPPH scavenging activity value for New Zealand Manuka honey. The unpaired electron of DPPH forms a pair with hydrogen donated by a free radical scavenging antioxidant from honey.
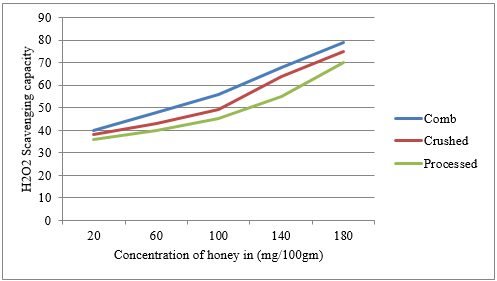
Hydrogen peroxide scavenging (H2O2)
The hydrogen peroxide scavenging potentials of combs, crushed, and processed honeys were 57 ± 16.06, 52.99 ± 15.9, and 56.61 ± 4.86 % inhibitions, respectively (Table 2). There was a significant difference (p<0.05) between the honey samples. In this study, comb honey samples had higher hydrogen peroxide scavenging activity than crushed and processed honey. The current study result was in agreement with that reported by Hailu and Belay [30], 78.00 ± 4.82 and 67.22 ± 2.93 % for Schefflera abyssinica and polyfloral honey, respectively. The hydrogen peroxide concentration of New Zealand Manuka honey ranged from 16.1 ± 1.2 to 95.8 ± 9.1 Juraj et al. [43], which is in agreement with the current research. Hydrogen peroxide plays a key role in honey's antibacterial activity. The production of H2O2 in honey requires glucose oxidase (GOx) that oxidizes glucose and produces hydrogen peroxide [43].
Inhibition concentration
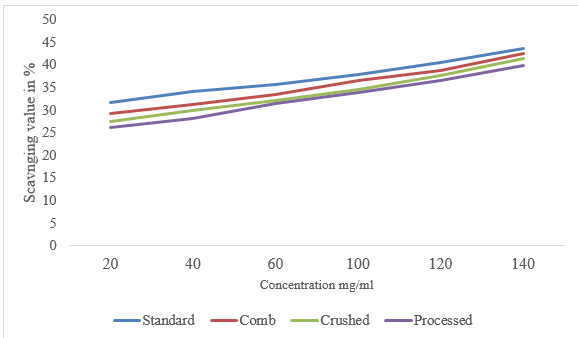
The DPPH IC 50 value of comb, crushed, and processed honey samples was analyzed with a concentration range of 20–140. The average DPPH IC50 values of comb, crushed and processed honey in the present study were 54±5.72, 80±6.25and 120±8.25 mg/ml, respectively (Table 2). A lower IC50 concentration in honey indicates a higher ability to neutralize free radicals [24]. There were significant differences among the honey samples in terms of their scavenging abilities, expressed as IC50 of the DPPH radical-scavenging activities. The increase in concentration shows an increase in the scavenging value of honey samples. The findings of this study on comb, crushed and processed honey were in agreement with the report of Hailu and Belay [30] 134.60 ± 8.66 for Schefflera abyssinica and 152.84 ± 8.25 mg/ml for polyfloral honey from Ethiopia.
Rheological properties
In this rheological property study of honey samples, dynamic viscosity with fluidity was measured in a temperature range of 20–50 o C with a constant shear rate of 50 s-1. As presented in Table 3, the average viscosity of comb, crushed, and processed honey samples as a function of temperature is found to be 4125, 2506, and 1543 Pa.s, respectively. The current study's comb, crushed, and processed honey's temperature sensitivity was evaluated by sketching the logarithmic of viscosity (Pa s) versus the reciprocal temperature (1/T) and the results were fitted using the Arrhenius model (Figure 2). The viscosity of all analyzed honey samples decreased with increasing temperature (Figure 2). The model adequately described the relationship between honey viscosity and temperature. In line with this, an exponential dependence of honey viscosity on temperature was evaluated with the use of regression analyses, and the coefficient of determination for comb, crushed, and processed honey samples was r2 = 0.874, r2 = 0.853, and r2 = 0.877, respectively (Table 3). The temperature dependence of the honey viscosity in the present study agrees with the reports of James et al., [44], for North-Central Nigeria honey; Oroian et al., [45] for Romanian honey; and Belay et al., [46] for Ethiopian monofloral honey. Similar observations to those of the present study were reported by Sopade et al., [47], for Australian honey, Yanniotis et al., [48], which reported that the temperature effect on viscosity is strong at lower temperatures. The Arrhenius relationship, which states that the higher the temperature, the greater the chemical reaction and molecular mobility of viscous fluids, is what causes the change in viscosity with an increase in temperature [49]. The average viscosity of each honey sample was higher at an initial 20 o C and decreased as the temperature increased (Table 3). The viscosity of combs, crushed and processed honeys obtained by fitting of the experimental data as a function of temperature is presented in (Table 3). At all operating temperatures (20, 30, 40, 50 o C), the highest viscosity was observed in the comb and the lowest was in processed honey. Generally, as the temperature increases, the average velocity of the molecules in honey increases and the amount of contact time with adjacent molecules decreases Gomez et al., [49] and thus, the average intermolecular forces decrease and the viscosity decreases. The effect of temperature was found to be more pronounced up to 30 o C. However, at temperatures above 30 oC, the differences in viscosity were very small in most of the analyzed honeys. At higher temperatures, the difference in viscosity among three honey types decreases but still exists even at 40 o C, which could be attributed to the natural variations in composition (sugar and water content) Yanniotis et al. [48]. The analyzed honey samples of the present study exhibited Newtonian behavior (Figure 3), which was described by the linearity of shearing time (1/s) and viscosity (Pa.s). Most honeys are Newtonian fluids Dobre, et al., [50], Oroian et al., [45] and characterized by constant viscosity at a fixed temperature, which can be described by Newton’s law for flow. The finding of the study was in agreement with the report of Vanelle et al., [51], for Brazilian honeys and Mahder and Belay et al., [52].
Table S3. Antioxidant analysis of comb, crushed and processed honey
| Treatment | Phenol (mg GAE/100g) | Flavonoid (mg CEQ/ 100g) | DPPH (% inhibition ) | H2O2 SCV |
|---|---|---|---|---|
| Comb | 68 | 42 | 20.58 | 38.4 |
| Comb | 70 | 52 | 22.6 | 44.7 |
| Comb | 77 | 78 | 30.16 | 53.5 |
| Comb | 101 | 92 | 33.21 | 65.9 |
| Comb | 187 | 98 | 35.05 | 80.3 |
| Comb | 71 | 26 | 37.47 | 37.7 |
| Comb | 104 | 30 | 25.31 | 45.3 |
| Comb | 137 | 36 | 26.42 | 57.9 |
| Comb | 175 | 38 | 28.47 | 69.5 |
| Comb | 191 | 70 | 33.68 | 79.4 |
| Comb | 70 | 24 | 35.48 | 35.68 |
| Comb | 95 | 32 | 35.94 | 42.87 |
| Comb | 122 | 52 | 26.94 | 55.4 |
| Comb | 167 | 64 | 29.21 | 68.2 |
| Comb | 177 | 72 | 33.31 | 80 |
| Crushed | 34 | 12 | 33.68 | 33.7 |
| Crushed | 54 | 16 | 34 | 40.3 |
| Crushed | 81 | 26 | 34.89 | 43.75 |
| Crushed | 142 | 40 | 26.57 | 69.5 |
| Crushed | 172 | 52 | 29.16 | 76.5 |
| Crushed | 38 | 14 | 31.47 | 37 |
| Crushed | 50 | 16 | 34.16 | 40 |
| Crushed | 62 | 24 | 36.47 | 52 |
| Crushed | 78 | 32 | 37.36 | 61.7 |
| Crushed | 177 | 38 | 31.42 | 74.5 |
| Crushed | 32 | 12 | 32.57 | 34 |
| Crushed | 44 | 26 | 33.57 | 40.6 |
| Crushed | 52 | 38 | 35.68 | 51.7 |
| Crushed | 91 | 44 | 36.47 | 65 |
| Crushed | 157 | 52 | 38.42 | 74.6 |
| Processed | 23 | 30 | 21.36 | 39.4 |
| Processed | 33 | 32 | 27.94 | 46 |
| Processed | 82 | 36 | 31.79 | 55.7 |
| Processed | 86 | 40 | 36.78 | 61.6 |
| Processed | 103 | 44 | 38.31 | 74.9 |
| Processed | 30 | 12 | 42.68 | 38.3 |
| Processed | 41 | 14 | 29.52 | 45 |
| Processed | 60 | 18 | 33.42 | 54.6 |
| Processed | 66 | 20 | 33.52 | 69.8 |
| Processed | 112 | 40 | 35.36 | 79.6 |
| Processed | 39 | 12 | 36 | 37.6 |
| Processed | 58 | 32 | 36.21 | 44 |
| Processed | 67 | 34 | 32.21 | 55 |
| Processed | 78 | 38 | 32.36 | 69.6 |
| Processed | 122 | 40 | 32.42 | 78 |
GAE= Gallic Acid Equivalent, CEQ= Qurecetin Equivalent SCV=Scavenging value
Sensory test
The sensory attributes and descriptors of honey like colour (light brown, dark brown), appearance (colour, fermentation, viscosity), flavor (odour, taste), and taste (mouth feel, body, after taste), floral fruits (orange, rose), fresh (eucalyptus, mint), warm/aroma (caramel, smoked), and spoilage (teji) of comb, crushed, and processed honey were presented in Table 4. The means ±SD of comb honey sample for light brown (1.56 ±0.74), dark brown (5.49±0.76), orange (2.66±1.32), rose (2.81±1.47), mint (2.70±1.16), eucalyptus (4.98±0.89), sweet taste (5.24±1.06), body (5.49±0.78), after taste (5.02±0.72), caramel (3.25±1.39), smoked (3.09±1.75) and spoiled teji (1.54±0.70) in Table 1. The means ±SD of crushed honey samples were found to be light brown (3.29±1.12), dark brown (3.16±1.18), orange (3.01±1.36), rose (3.10±1.38), mint (2.87±1.13), eucalyptus (4.33±0.98), sweet taste (4.58±1.05), body (3.54±1.13), after taste (3.42±0.94), caramel (3.15 ±1.23), smoked (2.92±1.47) and spoiled-teji (2.43±0.72). The means ±SD value of processed honey sample were found light brown (5.04±0.76), dark brown (2.55±1.06), orange 93.02±1.33), rose (2.98±1.52),mint (2.45±1.15), eucalyptus (4.01±0.83), sweet taste (4.52± 0.89), body (3.36±1.14), after taste (3.27±1.13), caramel (3.68 ±1.24), smoked (2.68 ±1.34) and spoiled- teji (3.34±0.94) (Table 4). There was a significant (p<0>p<0>et al. [53], who reported comb honey taste (4.05±0.825), odour (4.05±0.759), colour (4.30±0.732) and aroma (3.75±0.550).
Table S4. The Viscosity of comb, crushed and processed honey samples at different temperatures (20-50°C)
| Treatment | Viscosity (cp) at different operation temperature (0C) | |||
|---|---|---|---|---|
20 | 30 | 40 | 50 | |
| Comb 1 | 9500 | 4000 | 1800 | 500 |
| Comb 2 | 11000 | 4000 | 1800 | 800 |
| Comb 3 | 10200 | 4000 | 1500 | 600 |
| Comb 4 | 10500 | 4050 | 1700 | 700 |
| Comb 5 | 10100 | 4000 | 1800 | 550 |
| Comb 6 | 10100 | 4100 | 1500 | 650 |
| Comb 7 | 10445 | 4050 | 1850 | 500 |
| Comb 8 | 11000 | 4100 | 1750 | 600 |
| Comb 9 | 9500 | 4000 | 1800 | 800 |
| Comb 10 | 9322 | 3700 | 1500 | 630 |
| Crushed 1 | 6800 | 2500 | 1000 | 600 |
| Crushed 2 | 7200 | 3000 | 1200 | 500 |
| Crushed 3 | 4500 | 1700 | 590 | 490 |
| Crushed 4 | 6600 | 2500 | 990 | 650 |
| Crushed 5 | 6200 | 2300 | 1000 | 450 |
| Crushed 6 | 6500 | 1900 | 950 | 500 |
| Crushed 7 | 5506 | 1700 | 1000 | 520 |
| Crushed 8 | 7200 | 3000 | 1200 | 500 |
| Crushed 9 | 6660 | 2900 | 590 | 600 |
| Crushed 10 | 4500 | 2500 | 780 | 490 |
| Processed 1 | 3400 | 1500 | 700 | 480 |
| Processed 2 | 5800 | 2200 | 1000 | 250 |
| Processed 3 | 1200 | 600 | 380 | 200 |
| Processed 4 | 3500 | 1530 | 680 | 300 |
| Processed 5 | 4300 | 2000 | 850 | 300 |
| Processed 6 | 5800 | 700 | 700 | 450 |
| Processed 7 | 1200 | 2200 | 800 | 200 |
| Processed 8 | 4860 | 600 | 1000 | 250 |
| Processed 9 | 3400 | 1500 | 390 | 420 |
| Processed 10 | 1200 | 600 | 3800 | 200 |
Association between variables
The physicochemical and antioxidant properties of comb, crushed, and processed honey samples were correlated by Pearson correlation (Table 5). Moisture and sucrose were found to be positively correlated (r = 0.88). This is based on the principle that the moisture and sucrose content of honey are widely related to the level of maturity and the harvesting season. A significant (p<.001) inverse association was observed between diastase activity and sucrose content (r= -0.86). This is based on the principle of early maturity at harvest and adulteration practice. Correlations were observed between total phenolic content and hydrogen peroxide scavenging activity (r=0.82), total flavonoids and total phenol content (r=0.61). The moisture and sucrose content of comb, crushed, and processed honey from the Burie district correlated significantly (p<0 r=0.88), r=663).>
Table S5. Sensory analysis of comb, crushed and processed honey
Treatment | Orange | Rose | Mint | Eucalyptus | Sweet taste | Body | Aftertaste | Ceramela | Smoked | Light brown | Dark brown | Teji |
Comb | 3 | 4 | 5 | 6 | 6 | 6 | 5 | 4 | 3 | 1 | 6 | 1 |
Comb | 2 | 1 | 4 | 6 | 5 | 5 | 5 | 5 | 6 | 3 | 6 | 3 |
Comb | 4 | 1 | 2 | 5 | 5 | 5 | 5 | 1 | 5 | 2 | 5 | 1 |
Comb | 4 | 6 | 4 | 3 | 6 | 6 | 5 | 5 | 6 | 1 | 6 | 1 |
Comb | 2 | 2 | 1 | 4 | 5 | 6 | 5 | 5 | 2 | 2 | 5 | 1 |
Comb | 3 | 3 | 3 | 5 | 5 | 5 | 4 | 4 | 4 | 4 | 5 | 2 |
Comb | 5 | 1 | 1 | 6 | 6 | 6 | 6 | 5 | 1 | 2 | 5 | 2 |
Comb | 1 | 1 | 1 | 5 | 5 | 6 | 5 | 2 | 1 | 1 | 6 | 1 |
Comb | 2 | 5 | 3 | 6 | 6 | 6 | 5 | 5 | 2 | 1 | 7 | 1 |
Comb | 3 | 4 | 4 | 4 | 5 | 5 | 5 | 4 | 2 | 1 | 5 | 2 |
Comb | 2 | 5 | 4 | 5 | 6 | 5 | 3 | 2 | 3 | 2 | 4 | 2 |
Comb | 4 | 4 | 3 | 6 | 6 | 6 | 5 | 1 | 1 | 1 | 6 | 1 |
Comb | 2 | 2 | 5 | 5 | 6 | 5 | 5 | 2 | 3 | 1 | 6 | 2 |
Comb | 1 | 5 | 4 | 5 | 6 | 6 | 5 | 6 | 3 | 2 | 5 | 2 |
Comb | 2 | 5 | 4 | 5 | 5 | 5 | 4 | 5 | 5 | 1 | 6 | 1 |
Comb | 1 | 2 | 4 | 6 | 6 | 6 | 5 | 4 | 2 | 1 | 6 | 1 |
Comb | 5 | 2 | 4 | 6 | 6 | 6 | 6 | 4 | 2 | 1 | 5 | 2 |
Comb | 5 | 3 | 3 | 5 | 6 | 6 | 6 | 4 | 2 | 2 | 6 | 2 |
Comb | 3 | 4 | 2 | 5 | 6 | 3 | 6 | 3 | 2 | 1 | 5 | 1 |
Comb | 4 | 1 | 2 | 5 | 6 | 6 | 6 | 1 | 2 | 2 | 6 | 1 |
Comb | 2 | 2 | 5 | 5 | 5 | 5 | 5 | 2 | 4 | 2 | 5 | 2 |
Comb | 2 | 1 | 2 | 5 | 5 | 5 | 5 | 1 | 6 | 1 | 5 | 2 |
Comb | 3 | 4 | 3 | 6 | 6 | 6 | 6 | 2 | 6 | 2 | 6 | 1 |
Comb | 1 | 1 | 1 | 5 | 6 | 6 | 5 | 1 | 6 | 1 | 5 | 1 |
Comb | 5 | 1 | 2 | 6 | 6 | 5 | 5 | 2 | 2 | 2 | 6 | 1 |
Comb | 4 | 3 | 2 | 5 | 4 | 6 | 5 | 3 | 1 | 1 | 6 | 2 |
Comb | 2 | 1 | 2 | 5 | 3 | 6 | 5 | 3 | 2 | 1 | 6 | 1 |
Comb | 2 | 2 | 3 | 5 | 4 | 5 | 5 | 2 | 4 | 2 | 5 | 2 |
Comb | 1 | 2 | 2 | 4 | 3 | 5 | 5 | 4 | 1 | 1 | 6 | 1 |
Comb | 4 | 2 | 3 | 3 | 5 | 6 | 4 | 2 | 5 | 1 | 6 | 2 |
Comb | 1 | 4 | 1 | 4 | 3 | 5 | 5 | 5 | 1 | 2 | 6 | 3 |
Comb | 1 | 5 | 2 | 5 | 4 | 5 | 5 | 4 | 5 | 2 | 5 | 1 |
Comb | 3 | 4 | 2 | 5 | 5 | 6 | 5 | 4 | 2 | 3 | 5 | 2 |
Crushed | 4 | 3 | 4 | 5 | 6 | 3 | 4 | 4 | 6 | 5 | 2 | 2 |
Crushed | 2 | 4 | 4 | 5 | 5 | 4 | 4 | 5 | 4 | 3 | 4 | 3 |
Crushed | 4 | 2 | 4 | 3 | 4 | 2 | 2 | 4 | 2 | 5 | 2 | 2 |
Crushed | 5 | 2 | 3 | 4 | 2 | 3 | 3 | 1 | 1 | 5 | 1 | 3 |
Crushed | 2 | 5 | 1 | 2 | 5 | 2 | 3 | 2 | 2 | 5 | 2 | 1 |
Crushed | 1 | 1 | 3 | 3 | 3 | 2 | 2 | 5 | 5 | 5 | 5 | 4 |
Crushed | 5 | 2 | 5 | 5 | 6 | 4 | 5 | 1 | 2 | 3 | 3 | 3 |
Crushed | 3 | 1 | 1 | 4 | 4 | 1 | 2 | 4 | 6 | 3 | 1 | 2 |
Crushed | 5 | 5 | 5 | 3 | 6 | 6 | 4 | 5 | 3 | 1 | 6 | 2 |
Crushed | 2 | 4 | 4 | 4 | 5 | 4 | 4 | 4 | 2 | 3 | 4 | 3 |
Crushed | 4 | 4 | 5 | 4 | 5 | 4 | 2 | 2 | 5 | 4 | 2 | 3 |
Crushed | 4 | 3 | 4 | 5 | 6 | 5 | 2 | 4 | 1 | 4 | 5 | 1 |
Crushed | 2 | 6 | 2 | 5 | 5 | 3 | 5 | 2 | 3 | 2 | 3 | 2 |
Crushed | 3 | 3 | 2 | 4 | 4 | 4 | 4 | 3 | 2 | 3 | 5 | 2 |
Crushed | 1 | 5 | 2 | 5 | 5 | 4 | 2 | 5 | 3 | 3 | 4 | 2 |
Crushed | 2 | 1 | 1 | 5 | 4 | 3 | 4 | 1 | 5 | 2 | 4 | 3 |
Crushed | 2 | 5 | 4 | 6 | 5 | 5 | 5 | 4 | 1 | 2 | 5 | 2 |
Crushed | 4 | 4 | 3 | 4 | 4 | 3 | 3 | 4 | 1 | 2 | 3 | 3 |
Crushed | 5 | 3 | 4 | 4 | 5 | 4 | 4 | 4 | 2 | 4 | 3 | 2 |
Crushed | 2 | 4 | 3 | 4 | 6 | 4 | 5 | 1 | 2 | 4 | 1 | 1 |
Crushed | 4 | 4 | 2 | 4 | 5 | 5 | 4 | 5 | 5 | 3 | 3 | 3 |
Crushed | 1 | 2 | 3 | 5 | 5 | 4 | 3 | 2 | 4 | 2 | 4 | 3 |
Crushed | 5 | 2 | 2 | 6 | 4 | 4 | 4 | 3 | 3 | 4 | 2 | 2 |
Crushed | 2 | 1 | 3 | 5 | 6 | 3 | 5 | 2 | 3 | 5 | 2 | 2 |
Crushed | 5 | 1 | 1 | 6 | 4 | 2 | 2 | 2 | 3 | 4 | 1 | 2 |
Crushed | 4 | 3 | 4 | 5 | 5 | 4 | 4 | 4 | 3 | 5 | 4 | 3 |
Crushed | 1 | 1 | 2 | 4 | 6 | 2 | 3 | 3 | 1 | 3 | 2 | 3 |
Crushed | 3 | 4 | 3 | 4 | 4 | 4 | 4 | 4 | 4 | 3 | 2 | 3 |
Crushed | 2 | 2 | 2 | 4 | 5 | 3 | 5 | 1 | 1 | 3 | 4 | 1 |
Crushed | 3 | 5 | 3 | 5 | 5 | 3 | 4 | 5 | 2 | 2 | 4 | 3 |
Crushed | 2 | 3 | 2 | 4 | 5 | 5 | 4 | 4 | 5 | 3 | 5 | 4 |
Crushed | 1 | 4 | 2 | 5 | 2 | 4 | 2 | 3 | 1 | 3 | 4 | 2 |
Crushed | 4 | 4 | 4 | 5 | 4 | 5 | 5 | 3 | 3 | 2 | 4 | 3 |
Processed | 4 | 5 | 5 | 2 | 5 | 3 | 5 | 5 | 4 | 6 | 2 | 4 |
Processed | 1 | 3 | 4 | 4 | 5 | 2 | 4 | 5 | 4 | 4 | 2 | 4 |
Processed | 3 | 4 | 5 | 4 | 5 | 2 | 3 | 3 | 2 | 5 | 3 | 4 |
Processed | 3 | 3 | 4 | 5 | 4 | 4 | 5 | 4 | 3 | 6 | 5 | 5 |
Processed | 1 | 5 | 2 | 2 | 3 | 2 | 5 | 3 | 2 | 5 | 2 | 5 |
Processed | 3 | 3 | 0 | 4 | 4 | 4 | 2 | 4 | 2 | 5 | 4 | 4 |
Processed | 1 | 5 | 1 | 5 | 5 | 4 | 4 | 5 | 1 | 4 | 4 | 4 |
Processed | 4 | 1 | 1 | 4 | 3 | 4 | 4 | 4 | 1 | 5 | 4 | 2 |
Processed | 2 | 6 | 2 | 4 | 5 | 3 | 3 | 6 | 2 | 6 | 2 | 5 |
Processed | 2 | 4 | 4 | 4 | 5 | 4 | 3 | 4 | 2 | 5 | 3 | 4 |
Processed | 5 | 6 | 2 | 4 | 5 | 2 | 2 | 4 | 5 | 5 | 2 | 4 |
Processed | 4 | 3 | 2 | 4 | 5 | 6 | 1 | 4 | 1 | 5 | 3 | 2 |
Processed | 4 | 5 | 3 | 5 | 5 | 4 | 4 | 4 | 3 | 4 | 4 | 3 |
Processed | 2 | 1 | 1 | 3 | 4 | 3 | 2 | 3 | 3 | 5 | 2 | 3 |
Processed | 1 | 5 | 2 | 4 | 4 | 3 | 2 | 1 | 5 | 4 | 5 | 2 |
Processed | 2 | 2 | 2 | 6 | 4 | 5 | 5 | 4 | 2 | 4 | 4 | 5 |
Processed | 4 | 4 | 2 | 5 | 6 | 2 | 4 | 5 | 1 | 4 | 2 | 3 |
Processed | 4 | 2 | 2 | 5 | 5 | 2 | 5 | 5 | 2 | 5 | 4 | 4 |
Processed | 5 | 1 | 4 | 4 | 5 | 6 | 2 | 6 | 1 | 6 | 3 | 2 |
Processed | 4 | 2 | 1 | 5 | 5 | 5 | 4 | 2 | 2 | 5 | 1 | 2 |
Processed | 2 | 2 | 4 | 5 | 5 | 5 | 3 | 5 | 5 | 5 | 2 | 4 |
Processed | 4 | 1 | 4 | 5 | 5 | 2 | 3 | 3 | 3 | 5 | 2 | 4 |
Processed | 6 | 2 | 2 | 6 | 4 | 2 | 6 | 4 | 2 | 6 | 1 | 2 |
Processed | 4 | 1 | 2 | 4 | 5 | 2 | 4 | 4 | 3 | 6 | 1 | 4 |
Processed | 1 | 1 | 2 | 5 | 4 | 3 | 3 | 3 | 5 | 6 | 2 | 4 |
Processed | 3 | 2 | 3 | 4 | 4 | 4 | 4 | 5 | 5 | 6 | 1 | 3 |
Processed | 2 | 1 | 1 | 4 | 5 | 4 | 4 | 4 | 1 | 5 | 4 | 4 |
Processed | 4 | 4 | 2 | 4 | 5 | 2 | 2 | 4 | 2 | 5 | 1 | 4 |
Processed | 1 | 3 | 1 | 4 | 6 | 5 | 4 | 1 | 1 | 5 | 4 | 2 |
Processed | 4 | 4 | 3 | 5 | 5 | 4 | 3 | 5 | 2 | 4 | 2 | 4 |
Processed | 4 | 3 | 2 | 3 | 6 | 2 | 3 | 3 | 2 | 6 | 2 | 4 |
Processed | 4 | 2 | 2 | 3 | 3 | 4 | 2 | 1 | 5 | 6 | 1 | 3 |
Processed | 3 | 4 | 4 | 4 | 3 | 3 | 3 | 3 | 5 | 5 | 3 | 4 |
ANOVA Table S14.Moisture content
| Source | DF | Sum of Squares | Mean Square | F Value | Pr>F |
|---|---|---|---|---|---|
| Between Groups | 2 | 180.866 | 90.433 | 210.84 | <.0001 |
| Within Groups | 27 | 11.581 | 0.428 |
|
|
| Total | 29 | 192.447 |
|
|
|
ANOVA Table S15. Ash content
| Source | DF | Sum of Squares | Mean Square | F Value | Pr>F |
|---|---|---|---|---|---|
| Between Groups | 2 | 0.1265 | 0.0632 | 2.94 | 0.070 |
| Within Groups | 27 | 0.581 | 0.021 |
|
|
| Total | 29 | 0.707 |
|
|
|
ANOVA Table S16. HMF content
| Source | DF | Sum of Squares | Mean Square | F Value | Pr>F |
|---|---|---|---|---|---|
| Between Groups | 2 | 170.823 | 85.4117500 | 4.02 | 0.029 |
| Within Groups | 27 | 573.692 | 21.247 |
|
|
| Total | 29 | 744.515 |
|
|
|
ANOVA Table S17.ph content
| Source | DF | Sum of Squares | Mean Square | F Value | Pr>F |
|---|---|---|---|---|---|
| Between Groups | 2 | 0.0164 | 0.008 | 1.21 | 0.313 |
| Within Groups | 27 | 0.183 | 0.0067 |
|
|
| Total | 29 | 0.199 |
|
|
|
ANOVA Table S18. Glucose
| Source | DF | Sum of Squares | Mean Square | F Value | Pr>F |
|---|---|---|---|---|---|
| Between Groups | 2 | 3.458 | 1.729 | 1.37 | 0.2707 |
| Within Groups | 27 | 34.031 | 1.260 |
|
|
| Total | 29 | 37.489 |
|
|
|
ANOVA Table S 19. Fructose
| Source | DF | Sum of Squares | Mean Square | F Value | Pr>F |
|---|---|---|---|---|---|
| Between Groups | 2 | 8.600 | 4.300 | 3.93 | 0.0319 |
| Within Groups | 27 | 29.567 | 1.095 |
|
|
| Total | 29 | 38.167 |
|
|
|
ANOVA Table S20. Sucrose
| Source | DF | Sum of Squares | Mean Square | F Value | Pr>F |
|---|---|---|---|---|---|
| Between Groups | 2 | 66.302 | 33.151 | 66.99 | <.0001 |
| Within Groups | 27 | 13.361 | 0.494 |
|
|
| Total | 29 | 79.663 |
|
|
|
ANOVA Table S21. Total phenolic content
| Source | DF | Sum of Squares | Mean Square | F Value | Pr>F |
|---|---|---|---|---|---|
| Between Groups | 2 | 22874.311 | 11437.155 | 5.84 | 0.0058 |
| Within Groups | 42 | 82258.666 | 1958.539 |
|
|
| Total | 44 | 105132.977 |
|
|
|
ANOVA Table S22. Total flavnoid
| Source | DF | Sum of Squares | Mean Square | F Value | Pr>F |
|---|---|---|---|---|---|
| Between Groups | 2 | 5888.711 | 2944.355 | 9.79 | 0.0003 |
| Within Groups | 42 | 12630.400 | 300.723 |
|
|
| Total | 44 | 18519.111 |
|
|
|
ANOVA Table S23.Hydrogen peroxide
| Source | DF | Sum of Squares | Mean Square | F Value | Pr>F |
|---|---|---|---|---|---|
| Between Groups | 2 | 145.844 | 72.922 | 0.30 | 0.7431 |
| Within Groups | 42 | 10240.655 | 243.825 |
|
|
| Total | 44 | 10386.499 |
|
|
|
ANOVA Table S24. Diastase
| Source | DF | Sum of Squares | Mean Square | F Value | Pr>F |
|---|---|---|---|---|---|
| Between Groups | 2 | 40.856 | 20.4284 | 20.18 | 0.0022 |
| Within Groups | 6 | 6.073 | 1.01225 |
|
|
| Total | 8 | 46.930 |
|
|
|
ANOVA Table S25. DPPH scavenging activity
| Source | DF | Sum of Squares | Mean Square | F Value | Pr>F |
|---|---|---|---|---|---|
| Between Groups | 2 | 97.048 | 48.524 | 2.73 | 0.0745 |
| Within Groups | 51 | 905.359 | 17.752 |
|
|
| Total | 53 | 1002.408 |
|
|
|
Conclusion
In this study, most honey samples fulfilled the quality standards established by national and international regulations, except some processed honey. Comb honey showed better physicochemical and antioxidant properties. The correlation of moisture with sucrose and diastase with sucrose are a good mark for quality control. Moreover, comb honey samples have good sensory profiles, having a light brown to dark brown color; floral fruits; and a fresh and sweet taste. Like elsewhere, the natural quality of honey is affected by post-harvest handling and processing.
Acknowledgement
We would like to sincerely thank the Department of Food Science and Applied Nutrition of AASTU and Ethiopian Meat and Dairy Industry Development (EMDID). Additionally, Mr. Demelash Hailu and Asaminaw Shewangizaw deserve particular thanks. Asnake Bekele is also acknowledged for making the map. A kind provision of Phadebas tablet from Phadebas-AB Sweden for enzyme analysis is also highly acknowledged.
Declarations
The work described has not been published before, it is not under consideration for publication elsewhere, and the submission to the Journal of Food Measurement and Characterization has been approved by all authors as well as the responsible authorities. If accepted, it will not be published elsewhere in the same form, in English or in any other language, including electronically without the written consent of the copyright holder, and the Journal of Food Measurement and Characterization will not be held legally responsible should there be any claims for compensation or dispute on authorship.
References
- N.Tekeba, E. Yeshitila (2018)., Review of Ethiopia’s Global Position in Honey and Other Bee Products Production and Marketing: Analysis of Sectoral Opportunities and Limitations, Journal of Biomed Science &Technology. 10, 3
- A. Workneh, J. Abebe, P. Ranjitha (2011)., Beekeeping Subsector Challenges and Constraints in Atsbi Wemberta District of Eastern Zone, Tigray Region, Ethiopia, Journal of Agricultural Extension and Rural Development. 3, 1
- N. Adgaba (2007), Atlas of pollen grains of major honeybee flora of Ethiopia, HBRC. 1,11
- CSA (2021)., Central Statistical Agency, agricultural sample survey report volume ii livestock and livestock characteristic statistical bulletin. 5, 89
- K. Haftu (2015)., Production and Quality Characteristics of Ethiopian Honey: A Review. Academic Journal of Entomology. 8, 4
- E. Lutz (2015)., Authenticity of Honey Major Analytical Challenge- Intertek Food service international laboratory report Journal, Food chemistry.
- B. Fatimah, G. Abubakar, and S. Aliyu, Analysis of Biochemical Composition of Honey Samples from North-East Nigeria, Journal of Biochemistry & Analytical Biochemistry. 2, 3 (2013).
- Codex Alimentarius Committee, Revised Codex standard for honey. (2001).
- S. Bogdanov, K. Ruoff, Physico-chemical methods for the characterization of unifloral honeys: a review, Journal of Apidologie. 35 (2004).
- A. Ajibola, Physicochemical and Physiological Values of Honey and Its Importance as a Functional Foods, International Journal of Food and Nutrition Science. 2, 21 (2015).
- M. Tosun, (Detection of adulteration in honey samples added various sugar syrups with 13C/12C isotope ratio analysis method, Journal of Food Chemistry. 138, 16 (2013).
- S. Bogdanov, P. Martin, Honey authenticity, Journal of Food Science Technology. 93 (2002)
- Y. Sileshi, J. Abebe, and B. Desalegn, Honey marketing, structure and conduct of honey market in Gozamen district, East Gojjam Zone, and Amhara Region, Journal of Cogent Food & Agriculture. 5, 1 (2019).
- A. Belay, W. Solomon, G. Bultossa, N. Adgaba, S. Melaku, Botanical origin, colour, granulation, and sensory properties of the Harenna forest honey Bale, Ethiopia, Journal of Food chemistry. 67, 22 (2015).
- H. Debela, and A. Belay, Caffeine, invertase enzyme and triangle test sensory panel used to differentiate Coffea arabica and Vernonia amygdalina honey, Journal Food Control. 12, 3 (2021).
- AOAC, Association of Official Analytical Chemists, Official methods of the analysis of official analytical chemists (15th ed., Vol. II). USA: Virginia. (1990).
- ES, Ethiopian Standard Honey specification, Second edition. (2018).
- S. Bogdanov, Harmonized method of the international honey commission. 8, 12 (2009).
- G. Beretta, P. Granata, M. Ferrero, M. Orioli, R. Facino, Standardization of antioxidant properties of honey by a combination of spectrophotometric assays and chemometrics,Journal of Analytica Chimica Acta. 5, 33 (2005).
- H. Leontowicz, M. Leontowicz, S. Gorinstein, O. Martin, S. Trakhtenberg, Apple peels and pulp as a source of bioactive compounds and their influence on digestibility and lipid profile in normal and atherogenic rats, Journal Medycyna Weterynaryjn. 63, 34 (2007).
- J. Wieczorek, F. Janusz, Z. Pomianowski, M. Wieczorek, Honey as a source of bioactive compounds, Journal of natural science. 29, 3 (2014).
- A. Meda, C. Lamien, M. Romito, J. Millogo, O. Nacoulma, Determination of the total phenolic, flavonoid and proline contents in Burkina Fasan honey, as well as their radical scavenging activity, Journal Food chemistry. 91, 3 (2005).
- R. Ruch, S. Cheng, J. Klaunig, Prevention of cytotoxicity and inhibition of intercellular communication by antioxidant catechin isolated from Chinese green tea, Journal Carcinogeesis. 10, 10 (1989).
- M. Al-Farsi, A. Al-Amri, A. Hadhrami, S. Al-Belushi, Color, flavonoids, phenolics and antioxidants of Omani honey, Journal of Heliyon. 4, 10 (2018).
- ISO, Sensory Analysis Methodology General Guidance for Establishing a Sensory Profile, International Organization for Standardization; ISO, 13299: ISO, Genéve Switzerland. (2016).
- ISO, 6658. Sensory Analysis Methodology. International Organization for Standardization (ISO), Geneva. (2005).
- M. Piana, A. PersanoOddo, E. Bentabol, S. Bogdanov, and D. Guyot, Sensory analysis applied to honey: State of the art. Journal of Apidologie. 35, (2004).
- B. Tura, and A. Admassu, Performance evaluation of herbaceous of bee forages for semi-arid parts of the rift valley of central, Ethiopia, Journal of Agricultural. 8, 53 (2018).
- EU Council Directive Relating to honey Official, Journal of the European Communities. 10, (2002).
- D. Hailu, and A. Belay, Melissopalynology and antioxidant properties used to differentiate Schefflera abyssinica and polyfloral honey, Journal of PLoS ONE. 15, 10 (2020).
- A. Belay, K. Worku, B. Geramawu, A. Nuru, S. Melaku, Physicochemical properties of the Harenna forest honey, Bale, Ethiopia, Food Chemistry. 41, 33 (2013).
- N. Kebede, P. Subramanian, and G. Mebrahtu, Physicochemical analysis of Tigray honey: an attempt to determine major quality markers of honey, Bulletin of the Chemical Societyof Ethiopia. 26, 11 (2012).
- A. Kumar, J. Gill, J. Bedi, M. Manav, M. Ansari, G. Walia, Sensorial and physicochemical analysis of Indian honeys for assessment of quality and floral origins, Journal Food Research. 8, 5 (2018).
- M. Eyobel, A. Wodaje, B. Lemessa, and T. Miresa, Physicochemical characterization and pesticide residue analysis of honey produced in West Shewa Zone, Ethiopia, American Journal of Applied Chemistry. 5, 6 (2017).
- P. Silva, C. Gauche, R. Gonzaga, C. Oliveira, Honey Chemical composition, stability and authenticity, Journal of. Food Chemistry. 1, 96 (2016).
- B. Tesfaye, D. Begna, M. Eshetu, Evaluation of Physico-Chemical Properties of Honey Produced in Bale Natural Forest, Southeastern Ethiopia. Journal of Agricultural Science and Food Technology. 2, 1 (2016).
- O. Erturk, S. Kalın, M. Ayvaz, physicochemical properties, bioactive components, and antioxidant and antimicrobial potentials of some selected honeys from different provinces of Turkey, British Food Journal. 4, 17 (2019).
- E. Gebru, A. Berhanu, L. Hayal and A. Solomon, Physicochemical characterization of honey from Debre-Nazret Kebelle of Tigray Region, Journal World Applied Sciences. 33, 12 (2015).
- K. do Nascimento, J. Sattler, L. Macedo, C. Gonza,´ I. de Melo, A. da Silva, Phenolic compounds, antioxidant capacity and physicochemical properties of Brazilian Apis mellifera honeys, Journal of LWT. 91 (2018).
- C. Alisi, O. Ojiako, C. AIgwe, O. Ujowundu, K. Anugweje, and G. Okwu, Antioxidant content and free radical scavenging activity of honeys of Apis mellifera of Obudu cattle ranch, Journal of Biochemistry. 2, 14 (2012).
- M. Goslinski, D. Nowak, L. Kłębukowska, Antioxidant properties and antimicrobial activity of manuka honey versus Polish honeys, Journal of Food Science and Technology. 57, 4 (2020).
- Schievano, E., Finotello, C., Mammi, S., Illy Belci, A., Colomban, S., & Navarini, L. (2015). Preliminary characterization of monofloral Coffea spp. honey: Correlation between potential biomarkers and pollen content. Journal of Agricultural and Food Chemistry, 63(25), 5858–5863.
- M. Juraj, B. Jana, P. Emanuel, and K. Jaroslav, Methylglyoxal may affect hydrogen peroxide accumulation in manuka honey through the inhibition of glucose oxidase, Journal of medicinal food. 17, 22 (2014).
- O. James, M. Mesubi, Y. Usman, K. Ajanaku, K. Ogunniran, O. Ajani, and T. Siyanbola, Physical characterization of some honey samples from North-Central Nigeria, Journal of Science. 4, (2009).
- M. Oroian, Physicochemical and Rheological Properties of Romanian Honeys, Journal of Food Biophysics. 7, (2012).
- A. Belay, D. Gulelat, B. Marc, B. Hannelore, A. Admasu, B. Kaleab, M. Samuel, Rheology and botanical origin of Ethiopian monofloral honey, Journal of LWT - Food Science and Technology.75, (2017).
- P. Sopade, P. Halley, D. Bhandari, B. Arcy, C. Doebler, N. Caffin, Application of the Williams Landel-Ferry model to the viscosity-temperature relationship of Australian honeys, Journal of Food Engineering. 5, 6 (2003).
- S. Yanniotis, S. Skaltsi, and S. Karaburnioti, Effect of moisture content on the viscosity of honey at different temperatures, Journal of Food Engineering. 72, 33 (2006).
- D. Gomez, J. Navaza, and L. Quint, Effect of temperature on the viscosity of honeys, Journal of Food Properties. 12, 2 (2009).
- I. Dobre, L. Georescu, P. Alexe, O. Escuredo, M. Seijo, Rheological behaviour of different honey types from Romania, Journal of Food Research. 49, (2012).
- M. Vanelle, R. Silva, T. de Almeida, & R. Jaime, Rheological properties of selected Brazilian honeys as a function of temperature and soluble solid concentration, Journal of Food Properties. 20, 3 (2017).
- M. Mulugeta & A. Belay, Comb honey and processed honey of Croton macrostachyus and Schefflera abyssinica honey differentiated by enzymes and antioxidant properties, and botanical origin, Heliyone. 95, 12 (2022).
- A. Guler, B. Yuksel, K. Veli, Verification test of sensory analyses of comb and strained honeys produced as pure and feeding intensively with sucrose syrup, Journal of Food Chemistry. 10, 9 (2008).