
Research Article | DOI: https://doi.org/10.58489/2836-3582/003
*Corresponding Author: Endang ERNANDINI
Citation: E. Ernandini, N. Nusdwinuringtyas, T.A. Pakasi, A. Anjani. (2022). Exercise Intensity and Borg’s Scale as Self-Monitoring Tools in Wheelchair Test for Soldiers with Post-traumatic Lower Limb Injury. Journal of Hematology and Disorders. 1(1). 10.58489/2836-3582/003
Copyright: © 2022 E. Ernandini, this is an open access article distributed under the Creative Commons Attribution License, which permits unrestricted use, distribution, and reproduction in any medium, provided the original work is properly cited.
Received: 15 December 2022 | Accepted: 22 December 2022 | Published: 30 December 2022
Keywords: Exercise Intensity, Heart Rate, Borg’s scale, Wheelchair, Endurance.
Background: Soldiers recovering from lower limb injury must maintain their endurance to return to duty. Wheelchair is commonly used for exercising during the recovery process to maintain muscular and cardiorespiratory endurance. Aim of the study is to assess heart rate (HR) or exercise intensity and Borg’s scale as self-monitoring tools in wheelchair exercise for soldiers.
Methods: Design of the study is cross-sectional internal comparison study. One hundred and four healthy, well-trained male normal soldiers (NS) performed 12 minutes tests: (1) running, (2) wheeling a sports wheelchair. Fifty injured soldiers (IS) performed 12 minutes wheeling test. HR and distance were measured using a smartwatch. The HR was then used as a measurement for exercise intensity. Borg’s perceived score of effort, dyspnea, and fatigue was obtained by conducting interviews.
Result: There is no significant difference in the characteristics of NS and IS, thus the subjects in both groups are comparable. Distance and intensity values were significantly lower in the wheeling test than in the running test (P<0.05). During the running test, all subjects could reach their maximum level of intensity, whereas, during the wheeling test, both NS and IS subjects reached the moderate-vigorous level of intensity.
The Borg’s scale showed a significant difference in dyspnea and fatigue scores between running and wheeling (P<0.05). In the NS group, an interesting phenomenon emerged, there was a difference between the onset of dyspnea and fatigue. Dyspnea occured prior to leg fatigue during the running test. On the other hand, when they performed wheeling test, dyspnoe occurs later and is not even felt, instead arm fatigue will appears fist.
Conclusion: Counting of HR for exercise intensity, Borg’s scale (dyspnea and fatigue) can be a convenient alternative for self-monitoring wheeling exercise. These two tools are meant to help assessing safety and goals of exercise.
Injuries are common within the military population. There is no published data stating the number of injured soldiers until 2020. According to the author’s experience, about 10% of all injured soldiers will become disabled. Data from Indonesia’s Ministry of Defence’s Rehabilitation Center shows that in 2018 there were 6640 disabled soldiers aged 23 to 58, with 75% having below the lumbar region injuries, such as fracture, amputation of the hip, knee, ankle, and spinal cord injury [1].
After an injury, the body will experience immobilization during the recovery period, decreasing muscle strength and physical endurance tolerance. Muscle strength and endurance tolerance will decrease by 10 – 15% during one week of total bed rest. Studies of healthy individuals on total bed rest have shown 20 – 40% strength reduction in the legs and more than 5% reduction in the arms. In addition, the myofibril strength per muscle fiber volume is also decreasing [2]. The exercise rehabilitation program is essential during the recovery process, as it increases strength and endurance. Accordingly, a rehabilitation program is necessary to help improve soldiers’ condition, thereby preparing them for a return to duty, sport, or even combat [3,4].
Soldiers with injuries below the lumbar level usually have ambulating problems; hence, an assistive device is required. They are also unable to perform exercises that they used to do, such as running. The wheelchair is one of the most commonly used assistive devices to promote mobility and assist individuals with disabilities in adapting to daily activities. Wheelchair can also be used for exercise to maintain muscles and cardiorespiratory endurance, which benefits the overall well-being. Previous studies also showed improvement in the duration of upper body endurance following a 12-week home exercise program for manual wheelchair users [5]. However, during wheelchair exercise, It is important to consider the duration, distance, movement, and intensity of the exercise to improve functional capacity and fitness level [6]. Exercise that is too light cannot increase oxygen consumption per minute (VO2max) and thus does not improve fitness level [7]. On the other hand, an overly vigorous exercise can be harmful. Therefore, self-monitoring is necessary to monitor exercise intensity and prevent/reduce risks.
Since The Cardiopulmonary Exercise Testing (CPET) device is not available in Indonesia, it is necessary to use alternative tools and methods for assessing exercise intensity. Exercise intensity is influenced by various factors of each individual, such as age, health status, genetics, physiological and psychological aspects. The VO2max value is the gold standard for determining exercise intensity. It refers to the individual’s maximum oxygen uptake during peak exercise intensity. The exercise intensity indicated by VO2max relates to heart rate. Schantz et al [8]. stated the close relationship between the pulse rate in estimating a person's oxygen consumption. Thus, HR and the VO2max are also equivalent in determining a person's physical activity intensity level. Moreover, measuring heart rate is more convenient in a community setting, as non-medical professionals can do it accurately.
The Borg’s scale is a tool for measuring an individual’s effort and exertion, dyspnea, and fatigue during physical activity [9] and so is highly relevant for safety practice. The scale is a simple numerical list. It indicates how hard the body is working based on the physical sensations experienced by the subject [10]. Both HR and Borg’s scale represent promising self-monitoring tools in wheeling exercise.
The objective of this study was to compare the exercise intensity between wheeling and running using the heart rate and Borg’s scale. By comparing normal soldiers (NS) and injured or disable soldiers (IS) with similar features, the obtained results should be applicable to both NS and IS. The findings will be used to advocate wheelchair exercise for IS and the use of heart rate and Borg’s scale as self-monitoring tools.
Subjects
This study was conducted among healthy, well-trained male soldiers NS group (n=104) and IS group (n=50). The minimum number of subjects is calculated using the sample size estimation formula for two paired population groups [11].
The subjects consist of normal soldiers (n=104) and injured soldiers (n=50). A total of 130 male NS were selected to participate in the study, of which 26 (20%) were excluded due to a medical condition or failure to complete both tests. Eighty-five IS were selected to participate in the study, of which 35 (41%) were excluded due to medical conditions. Finally, data from 104 NS and 50 IS were included in the analysis
Descriptive data for each group are shown in Table III. There was no significant difference between NS and IS groups. Table IV shows the characteristics of the NS based on age group. Mean BMI for the age group 29 – 39 years was normal, whereas there was a slight increase among the other age groups. All other parameters were normal, and no differences between age groups were observed. These indicate that all subjects were healthy and had similar conditions during data collection.
Comparison of distance, exercise intensity, and Borg’s scale between NS and IS group are shown in Table V. There was a significant difference in distance, Borg’s perceived effort and dyspnea score (P<0.05). Table VI shows a comparison of distance, exercise intensity, and Borg’s scale between running and wheeling tests in NS group in relation to age group. Distance and exercise intensity both showed lower values in wheeling compared to running. There is a significant difference in exercise intensity between the running and wheeling tests in all age groups (P<0>P<0>
The Borg’s scale result showed a significant difference in dyspnea and fatigue scores between running and wheeling but no difference in effort scores. The Borg’s dyspnea score in the running was 5 (severe), while in wheeling was 2 (slight) (P<0>P<0>
The relationships between distance and age (NS and IS) are illustrated in Fig.1. The figure showed that mean distance both in running and wheeling decreased as the age group increased. The distance decrement in the running test was steeper compared to the wheeling test. The distance difference between running and wheeling (NS) was 1108, 965, and 890 meters in the 19 – 29, 30 – 39, and 40 – 49 age groups, respectively. The distance difference between wheeling (NS) and wheeling (IS) was 182, 55 and 108 meters in the 19 – 29, 30 – 39, and 40 – 49 age groups, respectively. Fig.2 demonstrates the correlation between exercise intensity and age. To achieve maximum distance in a 12-minutes test, the wheeling intensity decrement across age groups was steeper than running.
Table III. Characteristics of the subjects (n=154)
Characteristics | Normal soldiers n = 104 | Injured soldiers n = 50 |
| Age (yr) | 32 ± 9 | 32 ± 7 |
| Weight (kg) | 69.7 ± 8.2 | 72.18 ± 10.55 |
| Height (cm) | 170 ± 4.1 | 169.6 ± 4.0 |
| BMI (kg/m2) | 24.22 ± 2.5 | 24.67 ± 5.0 |
| Systolic BP (mmHg) | 121 ± 11.5 | 123.86 ± 13.5 |
| Diastolic BP (mmHg) | 7.8 ± 9.0 | 78.92 ± 7.4 |
| Hemoglobin (g/dL) | 15.0 ± 1.3 | 14.9 ± 1.1 |
| Blood glucose level (GDS) (g/dL) | 95.8 ± 17.1 | 103.1 ± 45.4 |
Table note: Data were presented as mean ± standard deviation for normal distribution and median (minimum-maximum) for not normal distribution. There were no significant difference in characteristics between normal and injured soldiers groups.
Table IV. Characteristics of the Normal Subjects Based on Age Group (n=104)
Age (year) | Height (cm) | Weight (Kg) | BMI (Kg/m2) | Blood Pressure (mmHg) | Hemoglobin (g/dL) | Blood Glucose (g/dL) | |
Systole | Diastole | ||||||
19–29 (n=44) | 169 ± 4.1 | 64.1 ± 8 | 22.3 ± 2.2 | 120 ± 12 | 74 ± 10 | 14.8 ± 1.2 | 95 ± 18 |
30–39 (n=34) | 171 ± 4.6 | 75.1 ± 5.8 | 25.7 ± 1.7 | 119 ± 9 | 81 ± 8 | 15.3 ± 1.3 | 95 ± 15 |
40–49 (n=26) | 169 ± 3.9 | 72.1 ± 4.9 | 25.3 ± 1.5 | 125 ± 12 | 81 ± 6 | 15 ± 1.4 | 98 ± 15 |
Table note: Data were presented as mean ± standard deviation for normal distribution and median (minimum-maximum) for not normal distribution. There were no significant difference in all parameters between age groups.
Table V. Comparison of distance, intensity, and Borg’s scale between running (R) and wheeling (W) tests of NS in relation to age group
Age (year)
| Distance (m) | Intensity (%)* | Borg’s scale | |||||||
Effort | Dyspnea╪ | Fatigue | ||||||||
R | W | R | W | R | W | R | W | R (Leg) | W(Arm) | |
19–29 | 2680 ± 201╪ | 1572 ± 186 ╪ | 102 ± 1,8 | 75 ± 6,5 | 13 ╪ | 11 ╪ | 5 | 2 | 5 ╪ | 5 ╪ |
30–39 | 2434 ± 240╪ | 1420 ± 172╪ | 101 ± 2,2 | 79 ± 6,4 | 13 | 13 | 5 | 2 | 5 ╪ | 5 ╪ |
40–49 | 2234 ± 249 * | 1344 ± 175 * | 101 ± 1,7 | 83 ± 7,6 | 15 ╪ | 13 ╪ | 5 | 3 | 5 | 5 |
Table note: Data were presented as mean ± standard deviation for normal distribution and median (minimum-maximum) for not normal distribution. Significant mean difference was observed using *t-test (P<0.05), ╪Wilcoxon Sign–rank Test (P<0.05).
Table VI. Comparison of distance, intensity, and Borg’s scale between NS and IS groups during wheeling
Subjects | Distance (m)* | Intensity (%) | Borg’s scale | ||
Effort╪ | Dyspnea╪ | Fatigue (arm) | |||
| Normal soldiers (n = 104) | 1466 ± 201 | 78 ± 7 | 12 (9 – 17) | 2 (0 – 5) | 5 (2 – 7) |
Injured soldiers (n = 50) | 1349 ± 261 | 81 ± 9 | 13 (11 – 19) | 3 (0 – 10) | 5 (1 – 10) |
Table note: Data were presented as mean ± standard deviation for normal distribution and median (minimum-maximum) for not normal distribution. Significant mean difference was observed using *unpaired t-test (P<0>, ╪Mann-Whitney (P<0.05).
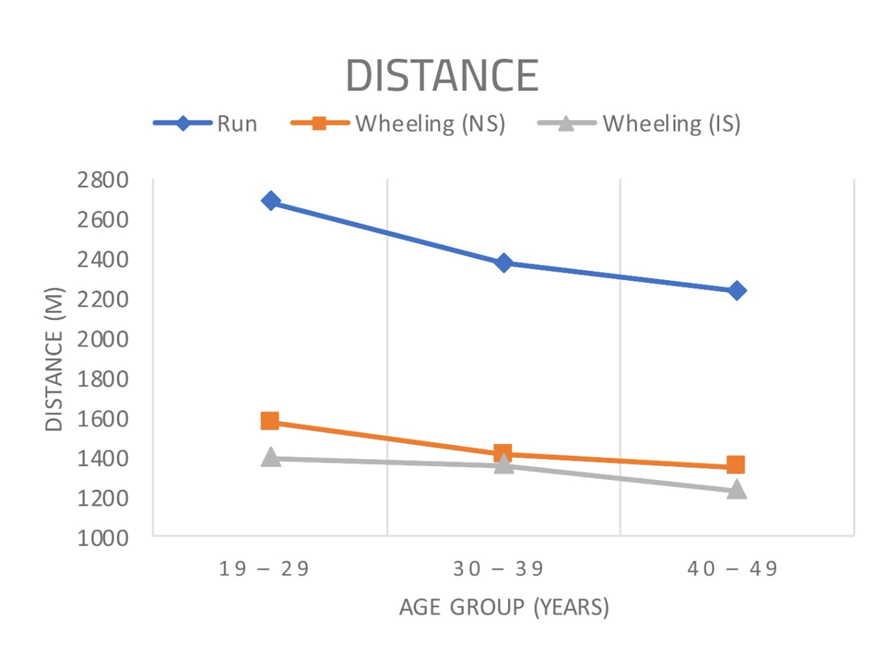
Figure 1. The associations between mean distance to running and wheeling in relation to age. Age significantly (P<0.05) correlated with mean distance both in running (NS) and wheeling (NS and IS).
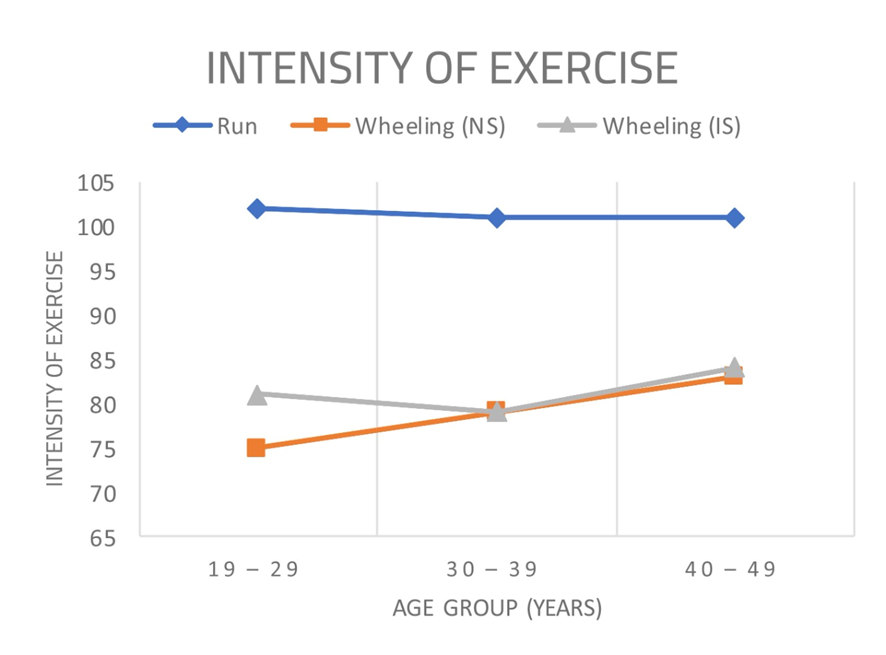
Figure 2. The associations between exercise intensity to running and wheeling in relation to age. Age significantly (P<0.05) correlated with mean distance both in running (NS) and wheeling (NS and IS).
In this study, we compared the exercise intensity and Borg’s scores between wheeling and running. Conducting running tests in IS is almost certainly impossible. Thus, we included both healthy NS and IS in this study and compared the characteristics and wheeling test results. There is no significant difference between characteristics of the NS and IS group (Table III). In other words, we can pair the characteristics of NS and IS. There is also no significant difference in the exercise intensity and Borg’s (arm) fatigue score between NS and IS groups (Table V). Both NS and IS group reached moderate-vigorous level of exercise intensity and Borg’s fatigue score was 5 (severe). A significant difference was found in distance, Borg’s perceived effort and dyspnea score between NS and IS group. The IS group had a higher Borg’s effort and dyspnea score while achieving a shorter distance. This occured because the IS were still in recovery state, therefore they had lower endurance compared to NS group.
The NS in this study were divided into three age groups with a range of 10 years in each group with characteristics (vital signs, body mass index, hemoglobin, and random blood glucose) within the normal range. Hence, this data is expected to represent the general population. Significant differences in exercise intensity were observed between running and wheeling across age groups. During the running test, all subjects reached their maximum exercise intensity, while during the wheeling test, the 19 – 29 and 30 – 39 age groups reached a moderate level of exercise intensity on average and the 40 – 49 age group reached a vigorous level of exercise intensity (Table VI). This finding confirmed the theory about the metabolic differences between the muscles involved in running and wheeling, as well as a decline in physical fitness as people age, which affects one's ability to exert more effort. (Fig.2). Muscle mass will naturally decrease by aging, 3 – 8% every decade after a person turns 30 years old, getting worse over the age of 50 years, which is 5 – 10% every decade.16–18
There is a difference in the amount of energy expended between running and wheeling. Running force the body to use practically all of its muscles, particularly the leg muscles, without the use of any equipment, increasing the amount of effort expended and raising the heart rate to its maximum. Wheeling, on the other hand, engages the majority of the trunk and upper limb muscles. When the person becomes fatigued, the wheelchair continues to produce distance on its own while allowing the person to rest. As a result, the maximum heart rate will not be reached.19–21 After exercise, muscles, tendons, ligaments, and energy require time to recover and repair within 24–48 hours.6 Therefore, the tests in this study were conducted at least 72 hours apart to allow adequate recovery time, thereby minimizing bias.
There is a significant difference in distance covered between running and wheeling (NS) across all age groups (Table VI). This result supports the theory that the muscles involved in running and wheeling have different metabolisms. Arm muscles have a high myosin ATPase activity, fast-twitch (type II) fibers, and high glycogen content, but low mitochondrial count and myoglobin content, resulting in a lower endurance value than leg muscles.22 This theory was stated in other studies by Aaron et al. 2004 which examined the achievement of VO2max in healthy athletes who ran on a treadmill and wheeled a static arm wheel using specific techniques until they reached the maximum capacity. The result shows that VO2max achieved while running on a treadmill was 44.4 L/kg/min, and wheeling a static arm wheel was 28.6 L/kg/min. In the author’s previous research using the CPET device, the disabled soldier group performing the wheeling test had the highest VO2peak value of 38 L/kg/min. In comparison, the normal soldier group performing the running test had the highest VO2max value of 64 L/kg/min. It means that disabled soldiers’ VO2max on the wheeling test was only 45 percent compared to the normal soldier group who ran.12
Distance in running and wheeling decreases with age (Fig.1), which correlates with cardiopulmonary endurance. According to Andrew et al.23, cardiopulmonary fitness declines with age. Their findings show that in the third and fourth decades of life, peak oxygen consumption per unit of time (VO2peak) declines by 3% to 6% per decade. Muscle strength and endurance both have a major impact on fitness levels, and both deteriorate with age.
Michael J Hutchinson et al, 2021, in his research stated that the usage of Borg’s scale RPE and CR 10 for able-body and SCI (paraplegia and tetraplegia) is correlated strongly and can be used also for upper and lower extremities in accordance with the test. At first, Michael et al considered that Borg's scale can only be used for assessing lower extremities fatigue. However, it is now believed that RCR 10 can be used to assess upper extremities fatigue.24
The Borg’s scale result showed a significant difference between the wheeling (NS) and running tests (Table VI). There is a significant difference in the average dyspnea score between running and wheeling across all age groups. The subjects experienced severe dyspnea during the running test, with a mean value of 5 across all age groups. In contrast, no subjects experienced moderate or severe dyspnea during the wheeling test. In the wheelchair test, the mean Borg’s dyspnea scale score across the 19 – 29, 30 – 39, and 40 – 49 groups were 2, 2, and 3, respectively. This demonstrates that age affects the participant’s subjective perception of dyspnea in wheeling exercise.
Dyspnea correlates with exercise intensity or maximum heart rate. During the running test, all subjects reached their maximum intensity and then entered the anaerobic phase. The body compensates for this phase by accelerating oxygen uptake to fulfill the body's oxygen and nutrient demands, which results in dyspnea and a rapid increase in heart rate.22
The findings show that the running test group reached a maximum intensity across all age groups, but exercise intensity declined as age increased. In comparison, in the wheeling test group (NS), we found that the 19 – 29 and 30 – 39 age groups reached a moderate level of intensity, and the 40 – 49 age groups reached a vigorous level of intensity, although not maximal. As shown in Fig.2, exercise intensity increased with age, ranging from moderate to vigorous. It increases with age, in conjunction with the Borg’s Rating of Perceived Exertion (RPE) Scale (6–20) value. This occurs as a result of age-related declines in physical performance, which results in increased exercise intensity and effort.
In the age groups 19 – 29 and 30 – 39, fatigue in the arm muscles during the wheeling test outweighed fatigue in the leg muscles during the running test. Meanwhile, in the 40 – 49 age group, leg fatigue during the running test was comparable to arm fatigue during the wheeling test. Furthermore, fatigue in the arms preceded the onset of dyspnea during the wheeling test. Arm fatigue causes the subject to reduce the amount of work performed with the arms, allowing the wheelchair to continue moving on its remaining energy. This is one of the body's defense mechanisms against further arm injury.19–21 While dyspnea occured prior to leg fatigue during the running test. The mean value for dyspnea on the Borg’s scale is 5 (severe) across all age groups. This finding is consistent with the theory that healthy individuals experience dyspnea prior to leg fatigue during running.
This study was applied to 2 large groups (NS and IS). At first, we assessed both group with the same test, which was the wheeling test. For the IS group, vigorous intensity was obtained with RPE 13, dyspnea level 3, fatigue 5. When compared with Borg's table, RPE 13 should be proportional to dyspnea 6 and fatigue 6. The results of observations in this study sharpened when comparing in NS subjects, where moderate - vigorous intensity was obtained with RPE 12, dyspnea level 2 and fatigue 5. When compared to Borg's scale, RPE 12 should be proportional to dyspnea 5 and fatigue 5. This significant difference exists especially for dyspnea score, where it is considered possible because the test conducted in this study was wheeling test, while Borg's table is intended for the running test. As explained in the discussion paragraph above, the fundamental difference is that the feeling of panting during wheeling test is not so prominent because the fatigue in the arm will appear first. This phenomenon should be investigated further.
Globally, there can also be seen differences in the subjective feeling felt by research subjects for running test. In this study, the test ran divided into 3 groups of NS1 (19-29) with the results of RPE 13, dyspnea 5 and fatigue 5. NS2 (30 – 39) with results of RPE 13 dyspnea 5(severe) fatigue 5 (severe). When compared with table Borg's with RPE 13 has dyspnea 6 and fatigue 6 (more than severe but not very severe). The difference may be small, but it cannot be omitted. The group (40 – 49) obtained a sharper comparison, namely, NS3 had RPE 15 dyspnea 5 and fatigue 5. Compare that to the Borg table which states RPE 15 has dyspnea 8 and fatigue 8. This situation can occur because this assessment is a subjective matter that is greatly affected by: perception, mood, culture, work and even the habit of practicing on research subjects. One point of possibility to investigate further.
In this research, NS achieved intensity of 79% in average (moderate intensity), in proportional to what Michael JH stated in his research. Intensity level for arm bicycle reached approximately 84%. RPE in this research reached 14 and CR10 showed 5, while another research showed RPE at 19 and CR10 at 9. This difference can occur because these researches were all based on subjective complaints. In addition, participants in these researches also have different background, which may affect the result. This research include soldier as subjects, which it can be assumed that soldiers are more resistant to fatigue than normal people [24].
According to Qi et al [23], the functional walking speed for wheelchair users is between 720 and 936 meters per 12 minutes. In this study, the average wheeling distance in the age groups of 19 – 29 years, 30 – 39 years, and 40 – 49 years were 1572 meters, 1410 meters, and 1344 meters, respectively. Thus, the wheeling distance travelled by the subjects in this study was considered to be within the exercise range.
Derek L Tran et al in their study stated that exercise exceeding the intensity of vigorous to high is unsafe or risky in patients with chronic heart diseases that have been intervened. Derek’s study showed all CHD patients was able to reach 88% of the percent predicted HR max (vigorous). When observed further, Derek et al did not list any hazardous things for the subjects of the study [25]. Hutchinson MJ does not state emphatically what intensity exercise is obtained during the wheeling exercise. It can be estimated from the table presented, the average results of exercise intensity in active paraplegy subjects who are still doing SCI recreational sports are 103% or beyond maximum intensity level. Until the end of the writing, not a single subject was declared in a state of danger [24]. That result can be compared with this study, where the intensity of exercise in the subject doing wheeling exercise reaches moderate – vigorous level. On further observation all subjects in this study were in good condition, and none of the complaints or worsening of the situation occurred, until three months later until the study was completed reported.
Based on some of the evidence above, researchers assume that doing wheeling wheelchair as aerobic exercise can reach moderate intensity – vigorous with safe results for both NS and IS. It is suggested to carry out further research for special cases such as CVD, DM, hypertension, CHD.
In every physical activity and sport there is a typical in itself sporting performance. Endurance training has a lesser impact on strength and a greater one on endurance. The combination of strength training with endurance training in a 2:1 ratio was proven to have a beneficial effect on both properties experimentally. Thus, in practice, the suggested formulation is as follows: strength: endurance = 33,33%: 66,67% [26]. The results of this study enhance the benefits of wheelchair exercise in maintaining muscle and cardiorespiratory endurance during recovery period of injured soldiers, as well as the use of exercise intensity and Borg’s scales as self-monitoring tools during the exercise.
This study has several limitations regarding equipment, facilities, and environment, particularly CPET, which is the gold standard for assessing cardiopulmonary function capacity. Environmental factors were difficult to control during outdoor testing although we attempted to minimize it by conducting the tests during the similar time and weather. Further research is also needed to analyze the increase in physical endurance in wheeling exercise; 12 weeks is suggested.
Wheeling is an aerobic exercise that can be used during rehabilitation program for soldiers with post-traumatic lower limb injury. During the running test, all NS could reach their maximum level of intensity, whereas, during the wheeling test, both NS and IS subjects reached the moderate-vigorous level of intensity. Exercise intensity (HR was then used as a measurement for exercise intensity) and Borg’s scale (dyspnea and fatigue) can be a convenient alternative for self-monitoring tools when performing wheelchair exercise as part of exercise rehabilitation programs. These two tools are safe and easy to use for assessing wheeling exercise.
There is no conflict of interest in this study.
Funding: The authors report no involvement in the research by the sponsor that could have influenced the outcome of this work.
Endang ERNANDINI has given substantial contributions to the conception of the design of the manuscript, Trevino A. PAKASI, to the analysis and interpretation of the data. All authors have participated in drafting the manuscript, and Nury NUSDWINURINGTYAS revised it critically. All authors read and approved the final version of the manuscript.
The authors acknowledge Nury NUSDWINURINGTYAS, who served as scientific advisor, Trevino A. PAKASI, for statistical analysis and interpretation of the data.