Archive : Article / Volume 2, Issue 2
- Research Article | DOI:
- https://doi.org/10.58489/2836-5062/010
Innovative Leadership Comparison of Ion Beam Applications, SA Belgium against its competitors
Swiss School of Business Research, Switzerland
Auj-E Taqaddas
Auj-E Taqaddas, (2023). Innovative Leadership Comparison of Ion Beam Applications, SA Belgium against its competitors. Journal of Clinical Oncology Reports. 2(2). DOI: 10.58489/2836-5062/010.
© 2023 Auj-E Taqaddas, this is an open access article distributed under the Creative Commons Attribution License, which permits unrestricted use, distribution, and reproduction in any medium, provided the original work is properly cited.
- Received Date: 29-12-2022
- Accepted Date: 10-01-2023
- Published Date: 27-02-2023
financial market analysis, hitachi, innovation, ion beam applications, medical device manufacturers, proton therapy.
Abstract
A modified innovative Leadership model was applied to assess the innovation capabilities and activities of Ion Beam Applications, Belgium, Hitachi, Japan, Varian Oncology Systems, USA, Accuray, USA and Siemens Healthineers, Germany in Proton Therapy and Radiation Oncology sector. The paper also contains Radiation Oncology market overview, financial market analysis and recommendations for Ion Beam Applications, Hitachi, Varian, Accuray and Siemens Healthineers. This paper forms part of PhD Portfolio and this study was carried out during course of PhD.
Introduction
Radiation therapy (RT) is one of the main modalities in Cancer treatment and it falls under the category of Radiation oncology. In past couple of decades there has been an explosion of technological advances in Radiation oncology especially in RT. Radiation therapy comes in various forms. The two main categories of RT are External Beam RT (EBRT) and internal RT or also known as brachytherapy. EBRT has photon based and proton-based treatment techniques. Photon beam Radiotherapy is generally employed to provide radiation treatment across the globe. However, the demand and usage of Particle beam therapy is increasing worldwide despite its higher cost compared to conventional linear accelerator (LINAC) based Photon Radiation Therapy. Particle Beam Therapy includes proton beam therapy (PBT) and heavy ion therapy. Proton beam centres are increasing worldwide primarily due to its dosimetric, biological and physical characteristics that have potential to provide more precise treatment resulting in better normal tissue sparing and tumour control. A study by Taqaddas has shown that experts working in the Proton beam therapy field are demanding improvements in the current technologies [1]. Similarly, another study on Surface Guided Radiotherapy has shown that there are problems with AlignRT and Vision RT and there is absence of compatibility with Proton Therapy delivery System [2]. A study on Robotic CyberKnife Technology has revealed that financial difficulty is one of the main challenges in implementing this technology [3]. The improvements in the existing Radiation oncology and medical Physics technologies are possible if proton beam therapy medical device manufacturers continue to be innovative and produce innovative products and processes that meet customer and patient needs. This prompted the researcher to assess the innovative capabilities and activities of 5 proton Beam Therapy Medical device manufacturers focusing on Ion Beam Applications, SA, Louvain-la-Neuve, Belgium. In the present study, Innovation leadership at company level in Ion Beam Applications, Louvain-la-Neuve, Belgium will be assessed and compared with Hitachi, Ltd, Japan, Varian Medical Systems, Inc. USA, Siemens Healthineers AG, Munich Germany and Accuray Incorporated, Sunnyvale, California, USA in the field of Proton therapy and Radiation oncology Industry. In the present study a model developed by Blagoev and Yordanova (2015) will be used to gage the innovative leadership at company level [4]. The model consists of 12 metrics. These metrics are used to assess innovation activities, potential and capabilities of these companies.
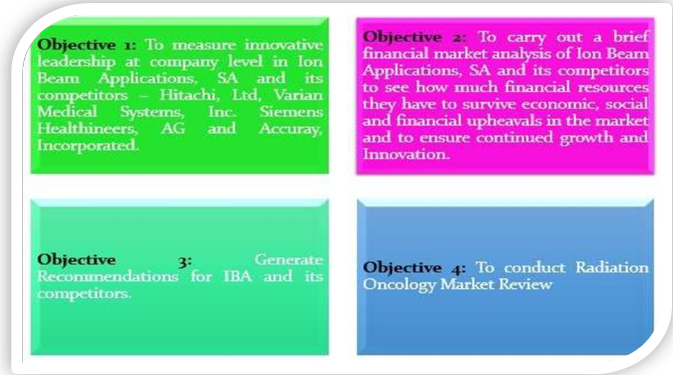
The objectives of the Research project are depicted in Fig.1
The research paper is written for informed reader and prior knowledge of the medical terminology is assumed. Definitions have been provided for more ambiguous terms in the glossary and in the text.
Literature Review
The demand for proton beam therapy is increasing worldwide and lot of Proton beam facilities have been built and many are under construction. However, adoption of new technologies especially Proton beam therapy is limited because of high implementation costs, lack of expertise and technological challenges. Yap et al. [5] state that the primary barrier to Charged particle therapy is still the cost as Charged particle facilities are run by affordability, functioning and complexity of current technology [5]. Advance delivery techniques are needed but limited by prolonged delivery times [5]. In the research paper 1, Taqaddas also described the features that are desired and required in Proton treatment Planning Systems, Beam delivery systems and Imaging systems [1]. Some of these improvements desired by Proton Beam Therapy experts include Faster layer switching times, better dose rate, better motion management, couch adapted to posterior oblique beams and better Image guided Radiation therapy capabilities. Some of the Improvements and features desired by experts in radiation treatment planning systems included use of machine learning, uniformity of algorithms, density correction tools, auto segmentation and multicriteria optimization [1]. Yap, et al. also states that the time to switch energy layers is a restricting feature of beam delivery systems (BDS) and influences beam delivery time [5]. A review carried out by Vidal et al. concluded that several technological challenges remain and many new technical developments need to be integrated into existing proton therapy systems [6]. Advances in accelerator field, spatial resolution attainable with Pencil beam scanning (PBS), better dose conformation to the target, arc therapy, flash therapy, adaptive proton beam therapy and small accelerator designs are some of the areas in which Particle therapy system vendors are investing in [6,7]. In order to give Flash proton therapy, accelerator technology needs to be improved so that high dose rates can be given. This means increasing current range from 1-10nA to more than 100nA and ability to carry out quick energy adjustment in milliseconds. This is particularly challenging for synchrotron-based systems. In addition to it pencil beam scanning speed needs to be increased 2 folds compared to current scanning speeds. Vendors of particle beam delivery systems and particle accelerators are putting in efforts to enhance technological features of particle therapy system. This in turn is related to innovation capabilities, competence and activities of the particle therapy system manufacturers. The results of research paper 1 has shown that experts are demanding improvements in current Proton beam therapy systems and associated technologies.
Conclusion
Studies reviewed provide adequate evidence that improvements are desired in current technologies especially particle beam therapy systems. A number of areas have been identified that require improvement and innovative solutions. Vendors are putting in effort to come up with more economical and fast solutions. This has led the PhD candidate to discuss the innovation capabilities, competences and activities of five Proton beam therapy vendor companies in the present study (research paper 4) to see how innovative these companies are, what technologies they have or are developing to resolve challenges currently faced by Proton beam therapy and Radiation oncology machine users and where they are heading in future. There are no studies that assess innovation capabilities, activities and competences of Particle beam therapy manufacturers especially no studies covering IBA, Hitachi, Varian, Accuray and siemens Healthineers. No studies have been conducted where Innovation leadership model has been applied to companies in Particle Beam therapy Industry. All of this prompted the researcher to select this area of study as topic of research for the present study.
Materials and Methods
Study overview and methods
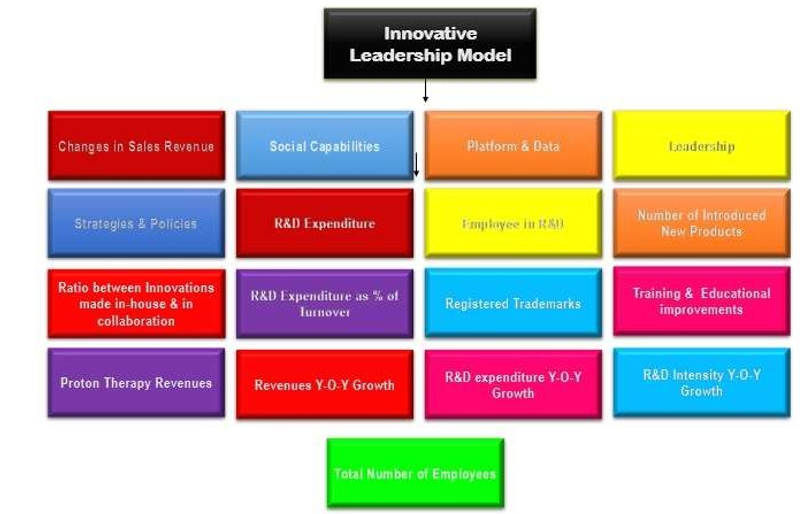
In the present study Company innovative leadership model suggested by Blagoev and Yordanova [4] is applied to assess the innovation activities, potential and capabilities of 5 Proton Beam Therapy medical device manufacturing companies. These companies include Ion Beam Applications, SA, Belgium, Varian Medical system, Inc. USA, Siemen Healthineers AG, Germany, and Accuray Incorporated, USA. The model proposed by Blagoev and Yordanova includes 12 metrics. These metrics are divided into 2 categories namely i) innovation Potential and Capabilities and II) Innovation Activities. The author of the present study has modified the model and have introduced some additional metrics which are Proton Revenues, Revenues Year-Over-Year Growth, R&D expenses Year-Over-Year Growth, R&D intensity Year-Over-Year Growth and total number of employee. In total there are 17 metrics. The modified model is shown in Fig.2. It is important to note that Siemens Healthineers AG, that has registered office in Munich, Germany completed acquisition of Varian medical system, Inc, head quartered in Palo, Alto, California on 15th April 2021 thereby creating a large radiation oncology business [8]. Therefore, for the purposes of this study, Financial statements of Siemens Healthineers will be used for 2021 and onwards. The study also provides a brief analysis of Global radiation oncology market. The study also involves a brief financial Market analysis of IBA and its competitors. This is a secondary data research. A wide range of industry sources were used for secondary research which includes:
- Company annual reports
- Company financial reports
- Company websites
- Company press releases
- Company presentations
- External websites
Selection of Companies for the study: Companies in this study were selected as they are major Particle beam therapy medical device manufacturers. IBA is a leader in proton beam therapy with 35 years of experience. Hitachi, Varian, Siemens Healthineers and Accuray are all major competitors of IBA in the field of Proton therapy and Radiation oncology industry.
Statistical Analysis: Data was logged into Microsoft Excel. Graphs were generated in Microsoft excel. Descriptive analysis including percentages, mean, median, minimum and maximum values were used to examine the results of study. Data was converted into points to see how each company performs in numerical terms. For each social media website used, for each platform developed, for each innovation & R&D strategy that company has, for each education & training course that company offers its employees and for each innovation leadership program that companies offer, 1 point is given. The Strategies and Policy matrix is measured on a scale of 10 points. It is difficult to convert Revenue and R&D investment, intensity and YOY growth data into points. In order to convert revenues and R&D investment figures into points, mean values were used. The company with highest mean value gets 5 points where as company with lowest mean value gets 1 point. 2nd highest mean values get 4 points, 3rd highest mean values get 3 points and 4th highest mean values get 2 points. For Revenue YOY Growth data, same method is applied for each year from 2021 to 2016 i.e. the company that shows highest change in revenues will get 5 points in that particular year and the company that shows lowest change in revenue gets 1 point for a particular year. R&D Investment YOY growth data is considered only for 2020 not for every year as all companies presented their growth individually in FY 2020. In 2021 Varian does not exist as separate entity. This is extra Metrix introduced by researcher. To convert R&D Intensity YOY growth data into points, again only data from 2020 was considered. Highest change in R&D intensity was awarded 5 points and lowest change in R&D intensity was awarded 1 point.
Supplemental Data: Eight Appendices are listed under supplemental Data. Appendix A contains currency exchange rates used for conversion into USD. Appendix B shows IBA Innovations in 2022, 2021, 2020, 2019 and 2018. Appendix C lists innovations made in-house and made in Collaboration by Hitachi Ltd. Appendix D contains Varian innovations in 2021, 2019 and 2018. Appendix E lists innovations of Siemens Healthineers. Appendix F lists Innovations of Accuray. Appendix G provides scores for all 5 companies. Appendix H provides a list of Abbreviations. Glossary is also provided at the end.
Results and Discussion
Results are described under following four main headings
- Company Code
- Innovation Potential and capabilities
- Innovation Activity
- Market overview
- Financial Market Analysis
- Company Codes
Each company is assigned a code. Table I shows codes assigned to companies.
Table 1: Company Codes

- Innovation Potential and capabilities
Six metrics will be discussed under Innovation potential and capabilities i.e. Sales data, change in sales revenue, social capabilities, platform and data, strategies and Innovation leadership. IBA data was obtained from [9,10,11, 12, 13, 14, 15, 16,17, 18, 19, 20, 21, 22]. Hitachi data was obtained from [23, 24, 25, 26, 27]. Siemens Healthineers
data was obtained from [8, 28, 29, 30, 31, 32]. Varian data was obtained from [33, 34, 35, 36, 37] and Accuracy data
was obtained from [39,40, 41, 42, 43, 44].
Net sales/revenues and change in sales or revenue
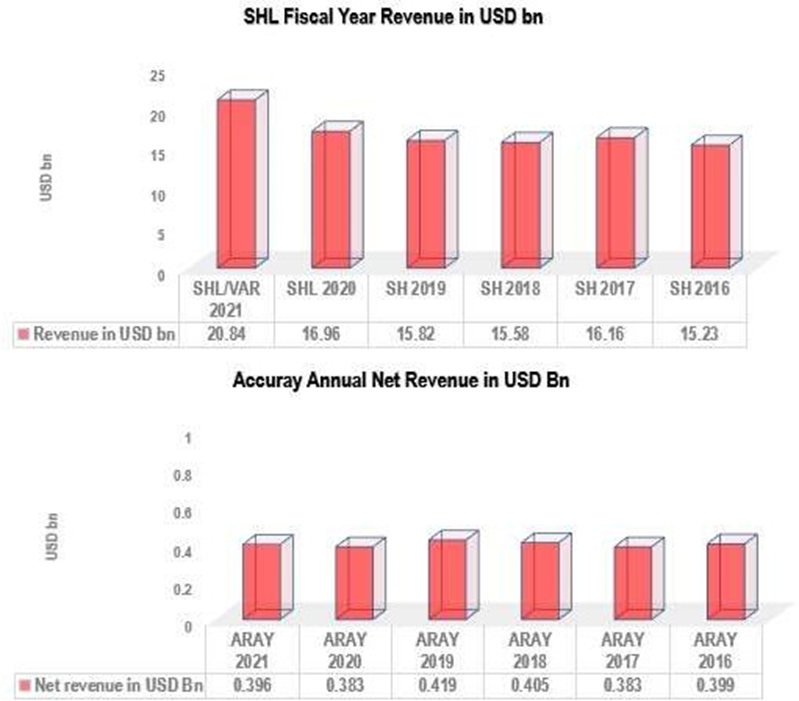
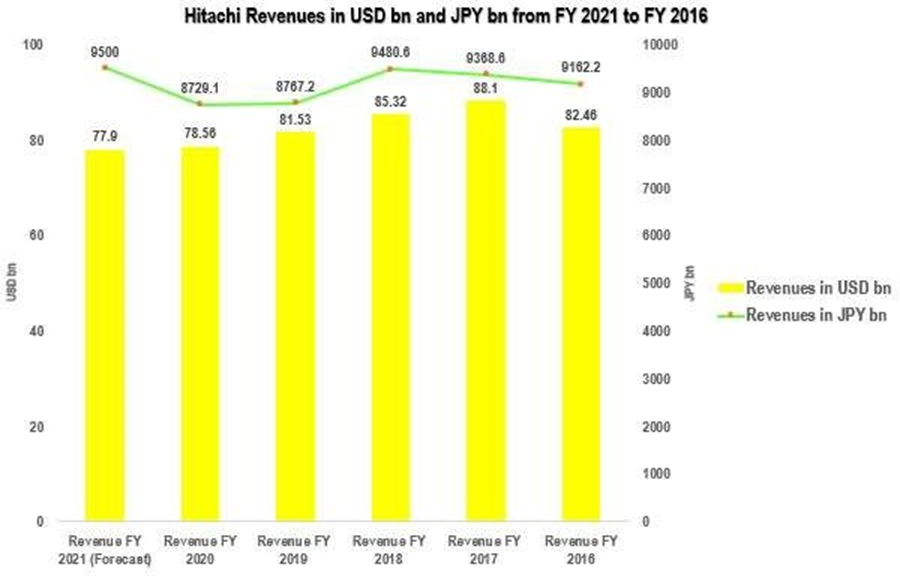
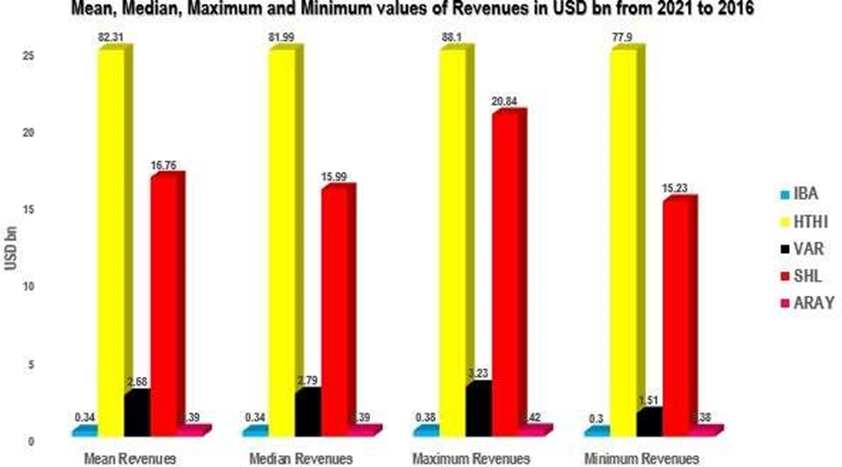
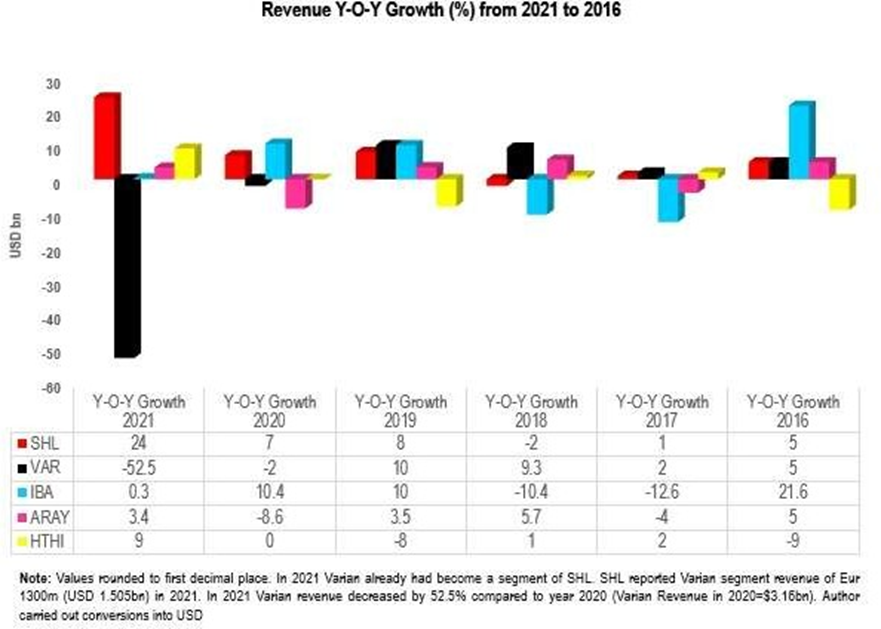
Results are shown in Fig. 3 -1 3
IBA Revenues and Y-O-Y Growth
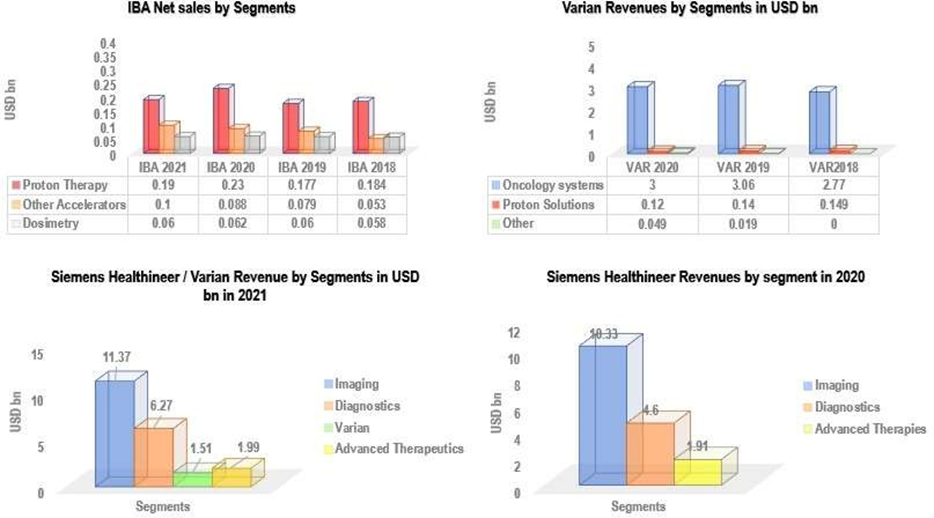
In case of IBA, Proton therapy Segment made highest revenue contributions toward total group revenue from 2020-2015. IBA proton therapy segment contributions towards revenue were greater than revenue contributions made by Proton Solutions segment of Varian Medical Systems from 2020-2018. IBA proton therapy segment generated USD 0.19, 0.23, 0.17, 0.18 bn in 2021, 2020, 2019 and 2018. In 2021, IBA experienced a decrease of 10.2% in Proton therapy revenue from previous year. In 2020, IBA had an increase of 19.5% in PT revenue compared to previous year. In 2019, 2018 and 2017, IBA PT revenues decreased by 1.3%, 18.3% and 13.34% respectively. In 2016 IBA saw increase in PT revenue of 39.9%. IBA revenues from 2021 to 2016 were lower than the revenues of its competitors. IBA produced USD 0.36, 0.38, 0.32,0.3, 0.34 and 0.35 bn in 2021, 2020, 2019, 2018, 2017 and in 2016 respectively.
IBA showed 10.4 %, 10% and 21.6 % change in Revenue in 2020, 2019 and 2016 compared to respective previous years. These Y-O-Y growth figures are highest compared to other four companies. In 2021 IBA showed 0.3 % increase (rounded to zero) in net revenues from previous year i.e., an increase of EUR 1.009 million. The decrease in revenue in 2021 was attributed to decrease in revenue generated by Proton Therapy segment. This decrease was partially offset by increase in revenue reported by Other Accelerator (USD 0.1bn) and Dosimetry segments (USD 0.06 bn). In 2019, IBA experienced 10% increase in revenue from previous year. In 2018 and 2017 IBA suffered decrease in revenues of 10.4% and 12.6% compared to 2017 and 2016 respectively. The decrease in revenue in 2018 and 2017 was attributed to slow proton market. Other accelerator segment revenue increased in 2021 and 2020 by 26.4% and 51.3% from 2020 and 2019 respectively. In 2018, there was 19.5% increase in other accelerator segment revenue where as in 2017, IBA suffered a decrease of -25.8% in Other Accelerator Segment Revenues. Dosimetry business saw increase in revenue in 2021, 2019 and in 2017 compared to previous years where as there was a decrease in Dosimetry revenue in 2020 compared to 2019 and in 2018 compared to 2017. Decrease in Dosimetry revenue of 5.2% in 2020 from 2019 was due to change in business scope arising from the sale of RadioMed in 2019. Despite Covid-19 Dosimetry business continued to acquire market share in 2020. IBA has the lowest mean ($ 0.34 bn), median ($0.34 bn), maximum ($ 0.38) and minimum ($ 0.3 bn) values of revenue in past 6 years from 2021-2016 compared to its competitors. Overall IBA showed significant resilience in all business segments with increased uptake of orders in almost all business lines.
Hitachi Revenue and Y-O-Y Growth
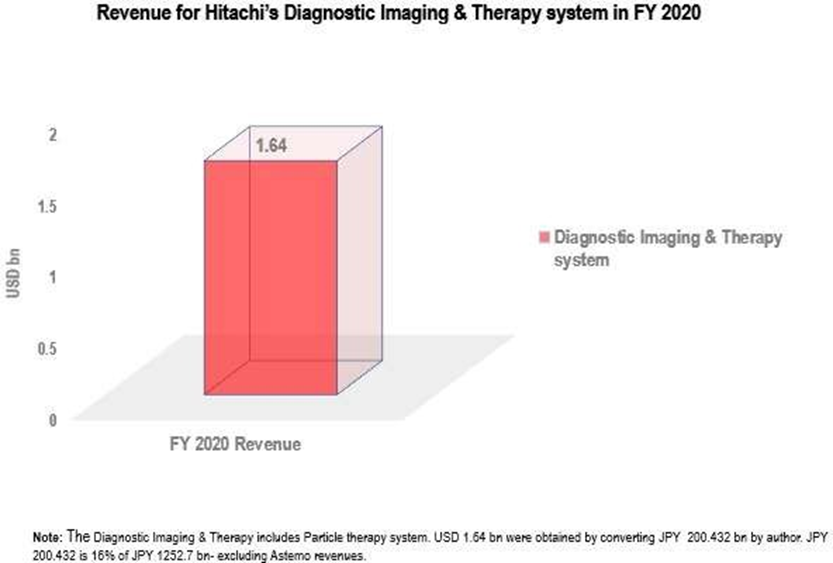
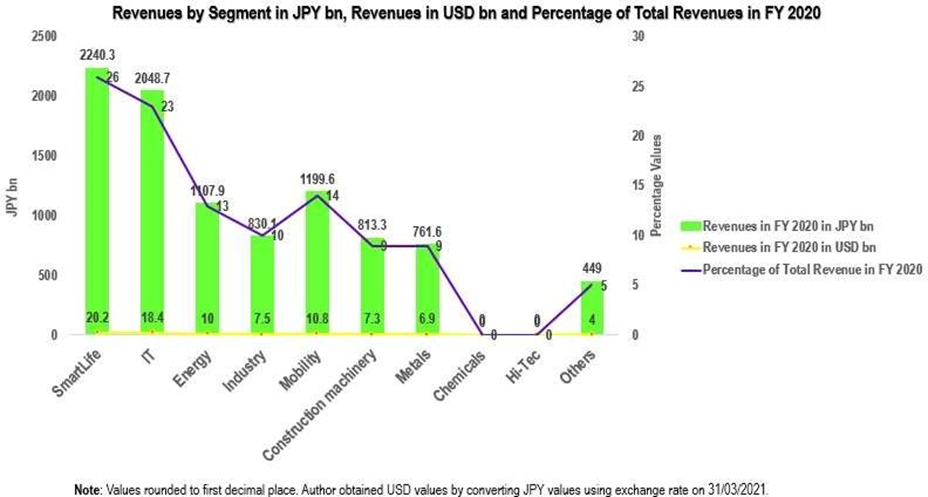
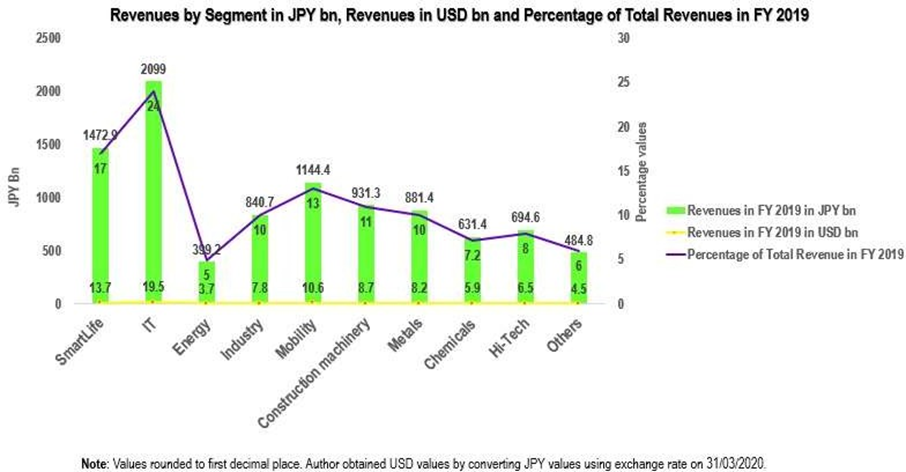
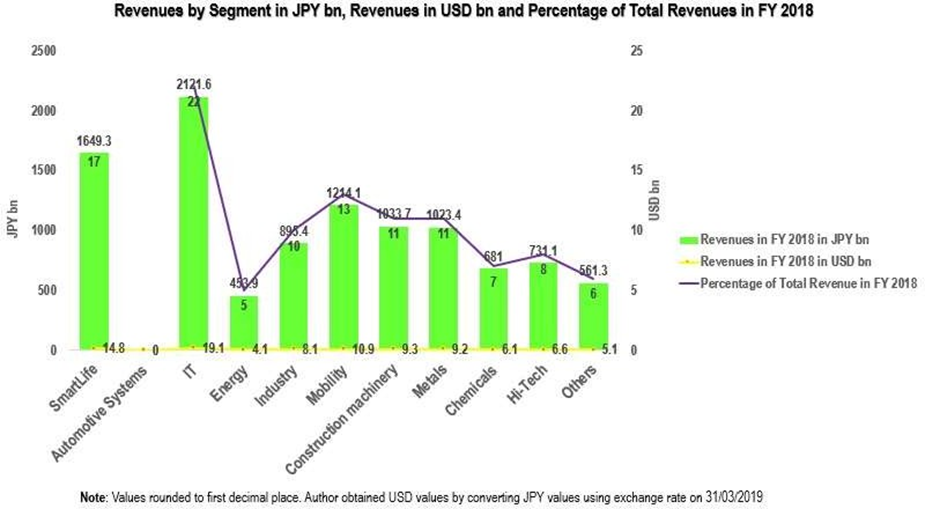
Results are depicted in Fig. Author of the present study converted Revenues in JPY into USD using currency exchange rates on 31st March. The currency exchange rates used in this study are shown in Appendix A. Hitachi revenues are significantly higher than other 4 companies. This is probably because Hitachi has 9 business segments and it not only operates in radiation oncology market but also operates in other sectors like automobiles, Energy, IT and metals. Hitachi forecasted revenue for 2021 are USD 77.9 bn. Hitachi revenues for 2020, 2019, 2018, 2017 and in 2016 were USD 78.56 bn, USD 81.53 bn, USD 85.32 bn, USD 88.1 bn and USD 82.46 bn respectively. The Y-O-Y growth was 9, 0, -8, 1, 2 and -9 for 2021, 2020, 2019,2018, 2017 and 2016 respectively. In FY 2020 Hitachi Smart life segmented contributed highest revenue towards the total company revenue. In 2019 and in 2018 IT segment contributed highest revenue. Hitachi revenues by segment for FY 2021 are not available yet. Hitachi does not provide Revenues for Proton therapy separately and therefore direct comparison of PT revenue with other companies is not possible. Proton Therapy falls under Smart life segment. Within Smart life segment is diagnostic imaging & therapy sub segment which includes Particle Therapy system. In 2020 diagnostic imaging & Therapy sub segment reported USD 1.64 bn. Hitachi mean, median, maximum and minimum revenues are $ 82.31, $ 81.99, $ 88.1, $ 77.9 bn over past 6 years from 2021-2016. These values are consistently and significantly higher than other 4 companies. This is a good indicator of its resilience in various markets. Overall, it seems Hitachi has resilient business lines as changes in overall company revenue decreased only in 2019 and 2016 from 2021-2016.
Siemens Healthineers Revenue and Y-O-Y Growth
SHL acquired Varian Medical systems on 15th April 2021 which significantly increased its presence in Radiation oncology and particle therapy markets. Siemens Healthineers revenues are significantly higher than IBA, Varian (before its merger) and Accuray. However, its group revenues are significantly lower than Hitachi, Ltd. Siemens Healthineers Revenues in 2021, 2020, 2019, 2018, 2017 and 2016 were $ 20.84bn, $16.96 bn, $15.82 b, $15.58 bn, $ 16.16 bn and $15.23 bn respectively. The company experienced 24% increase in revenue in 2021 compared to previous year. There was 7% increase in revenue in 2020 compared to 2019. In 2019 increase in revenue was 8% compared to previous year. In 2018 Siemens Healthineers revenues declined by -2%. In 2017 and 2016, Siemens Healthineers experienced 1% and 5% increase in revenues respectively.
Imaging segment made highest contribution towards total group revenue in 2021 and 2020 ($11.37 bn, $10.33 bn). Diagnostics segment generated $6.27 bn and $4.6 bn in 2021 and 2020 respectively. Advanced Therapeutics segment produced $1.99 bn and $1.91 bn in 2021 and 2020 respectively. Varian segment reported $1.51 bn in 2021. In 2021, highest revenue by region was shown by EMEA (Europe, Common Wealth of Independent States, Africa, Middle East) followed by Americas and Asia & Australia. In 2020 Highest revenue was generated by Americas followed by EMEA and Asia and Australia. The mean, median, maximum and minimum values over a period of six years from 2021- 2016 were $16.75 bn, $15.99 bn, $20.84 bn, and $15.23 bn respectively. These values are significantly higher than IBA, Varian and Accuracy. The author of the present study has converted Euros into USD using exchange rates given in Appendix A.
Varian Revenues and Y-O-Y Growth:
In 2021 Varian segment of Siemens Healthineers reported $1.505 bn in revenue. In 2020, Varian Medical Systems, Inc. generated $3.17 bn in Total revenues. In 2019 and 2018, the total revenues were $3.23bn and $ 2.92 bn respectively. In 2017 and 2016 Varian reported total revenues of $2.67 bn and $2.62 bn respectively. In 2021 and 2020 Varian revenue decreased by 52.5% and 2% compared to 2020 and 2019 respectively. Revenue wise Varian stood at third position i.e., has third largest revenues after Hitachi and Siemens Healthineers. Varian revenue increased by 10%, 9.3%, 2% and 5% in 2019, 2018, 2017 and 2016 respectively. Oncology Systems contributed highest revenue by segments of USD 3.0 bn, 3.06 bn, 2.77bn in 2020, 2019 and 2018 respectively. This means from 2019-2017 Varian’s change in revenue was highest and was comparable to IBA in 2019, comparable to Hitachi in 2017. Proton Solutions made second highest contributions of USD 0.12 bn, 0.14 bn and 0.15 bn in 2020, 2019 and 2018 respectively. Other Segment contributed $0.049bn and $0.019 bn in 2020 and 2019 respectively. No data was reported for other segment in 2018. Varian reports revenue by region in three categories (Americas, EMEA and APAC). From 2020-2017 Americas reported highest revenues, followed by EMEA and APAC.
Accuray revenues and Y-O-Y Growth:
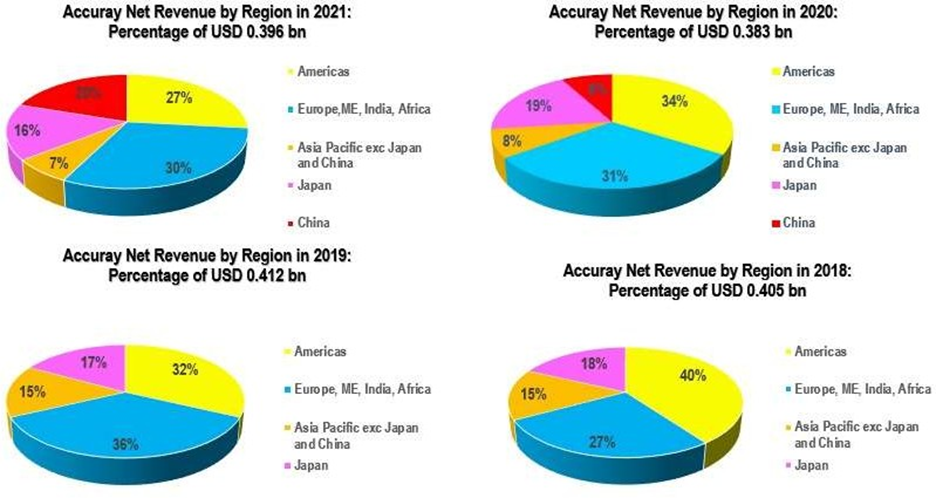
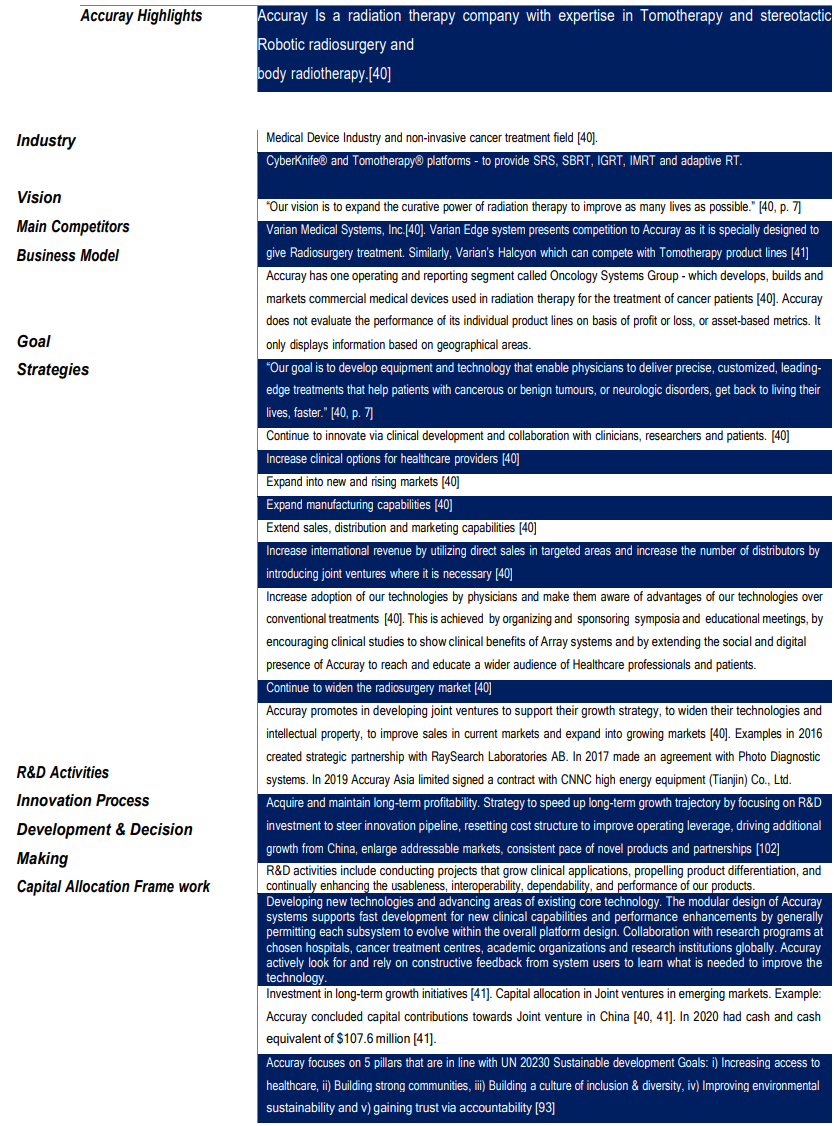
It has only one segment (Oncology Systems Group) to report and the company does not measure the performances of its individual product lines. Hence revenues and Asset information is displayed by geographic areas [41]. Accuracy reports revenues by geographical regions in 5 regions namely i) Americas, ii) Europe, Middle East, India and Africa, iii) Asia Pacific excluding Japan and China, iv) Japan and V) china. The total revenue of Accuracy was $ 0.396 bn in 2021. Total revenue was $0.383 bn, $0.42 bn, $ 0.41 bn, $0.38 bn, $0.399bn in 2020, 2019, 2018, 2017 and 2016 respectively. This puts Accuracy at position 4 with respect to revenues against its competitors. In 2021, Accuracy showed 3.4% increase in revenue from 2020. In 2020 Accuracy revenues decreased by 8.6% compared to previous year. In 2019 Accuracy again showed 3.5% increase in revenue from 2018. In 2018 and 2017 Accuracy showed 5.7% increase and 4 decrease in revenue from previous years respectively. In 2016, Accuray experienced 5% increase in revenue. In short, Accuray showed decline in revenues in 2020 and 2017. In 2021, region characterised by Europe, Middle East, India and Africa contributed highest revenue ($ 0.12 bn, 31%) followed by Americas (27%), China (20%), Japan (16%) and Asia Pacific (7%). In 2020, Americas contributed highest revenue (34%) toward total revenue followed by region characterised by Europe, Middle East, India and Africa (31%), Japan (19%), Asia Pacific (8%) and China (8%). It seems Covid-19 restriction in China negatively affected Accuray sales in China in 2020. However, sales in China increased in 2021. In 2019, region characterised by Europe, Middle East, India and Africa contributed highest revenues towards total revenue, followed by Americas, Japan, Asia Pacific and China.

Social capabilities
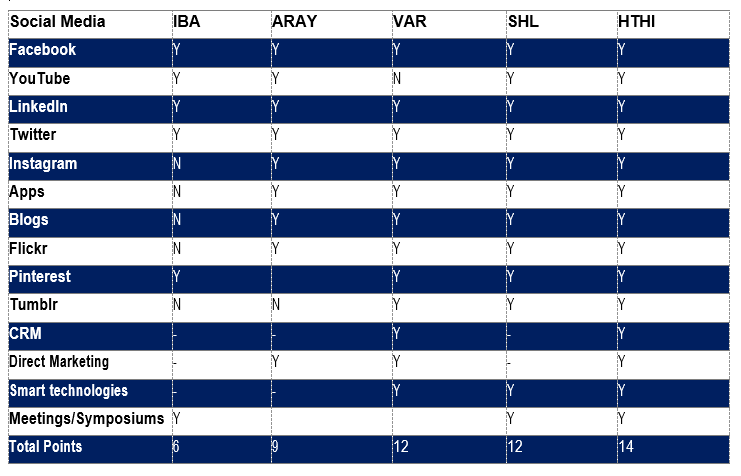
Results are shown in Table II. Companies are awarded one point for each social media platform they use.
Ion Beam Applications, SA is present on 4 social media websites i.e., YouTube, Facebook, LinkedIn and Twitter. IBA also arranges annual meetings, focus groups and symposiums for RT professionals to reach out to customers. For instance, in 2018, IBA hosted and 8th Annual Proteus® User meeting in Miami, USA that acted as a platform where world’s largest proton therapy community with 165 participants representing 40 countries exchanged ideas, provided real time feedback, discussed collaboration and carried out technical and clinical discussions [19]. Similarly, in 2019, IBA organized ninth Annual Proteus® User meeting in Miami, USA [45]. This is a good way to reach out users of proton therapy and understand their expectations and also to initiate collaboration with various organizations to develop new products that reflect emerging market trends and changing user preferences.
The official website of Hitachi, Ltd lists 5 social media websites i.e., Facebook, Twitter, YouTube, LinkedIn, and Instagram. However, Hitachi also uses direct marketing such as emails to communicate with its customers. In addition to it, Hitachi uses a number of smart technologies such as Covid-19 Smart Solutions, IoT, Big Data Analytics, Smart Public Safety and security solutions. These smart technologies are described in Platforms and data section in table. Hitachi also has Apps like Microsoft Power Apps and an encouragement to learning app [46]. Hitachi also arranges Energy summits and CIGRE biennial session and trade fairs [47]. However, unlike IBA, Hitachi has not offered any Proton beam therapy related annual meeting. Hitachi Home & Life is on Pinterest and has 145 followers. Hitachi runs a number of blogs such as blogs run by Vantara and Hitachi Solutions and Hitachi, Ltd [48,49]. Hitachi is present on Tumblr and Flicker [50,51] e.g., Hitachi trains on Flickr and Hitachi Vantara on Tumblr.
The Siemens Healthineer company website lists symbols of 5 social media platforms i.e., YouTube, Facebook, Instagram, LinkedIn and Twitter [52]. Siemens Healthcare and Siemens Healthineers offers Connect Platforms (digital platform) and Customer Services Smart Enablers such as Smart remote services, teamplay fleet and PEP connect [53]. Siemens Healthineers also offers healthcare executive summit; external innovation think tank exhibition 2022 and other events [54]. Besides being present on these 5 social media platforms, SHL also provides E-books and Apps such as Blood Gas App, Diabetes App and Urinalysis App for iPhone and iPad [55]. Accuray Incorporated website mentions 4 social media websites namely YouTube, Facebook, LinkedIn and Twitter [56]. However, Accuray is present on Instagram as well. Accuray also runs six blogs namely Astro Blogs, CyberKnife Blogs, Radixact, Estro, Adaptive and AI blogs [57]. Accuray also has released an App called Plan Touch iPad App for Accuray’s CyberKnife Radiation Therapy System so that physicians can review patient treatment plan data directly from their iPads [58]. Accuray has only 2 photos on Flickr. Accuray uses direct sales staff in most of western Europe, Japan, India and Canada [40]. In USA Accuray mainly employs direct sales and marketing [40]. Accuray uses multiple personnel within direct sales such as territory sales managers, product specialists, training specialists and marketing specialists. Varian company website allows visitors to connect with them via Facebook, LinkedIn and Twitter. Varian also runs blogs [59]. Varian also offers an App called Varian UniteTM mobile app to provide customers most up to date information about their products, Varian sponsored events and about latest cancer treatment techniques [60]. Another Varian app is called Oncology iOS application Varian mobile [61]. This app allows clinicians to manage appointments from their mobiles. Varian also offers cloud based Noona® App for real-time symptom reporting and management [62]. Varian is also present on Instagram [63], Flickr [64], and Pinterest [65] and Tumblr [66, 67]. On Flickr Varian has 90 Photos. Furthermore, Varian uses CRM base platforms to interact with its customers and third-party developers. Besides using independent distributors and resellers, Varian also uses direct sales to reach out to customers [33]. Varian uses a number of Smart technologies to connect with its customers and users of its technologies such as users of cloud based QumulateTM software gather and examine machine data in RT department. The software also permits users to compare their machine performance data and trends with community users’ data. Varian also uses AI-driven Ethos Adaptive technology [68].
Overall, it seems all companies are using a variety of social media channels to communicate with its users. However, they are not exploiting all the channels to their full extent. IBA seems to be using 6 channels out of
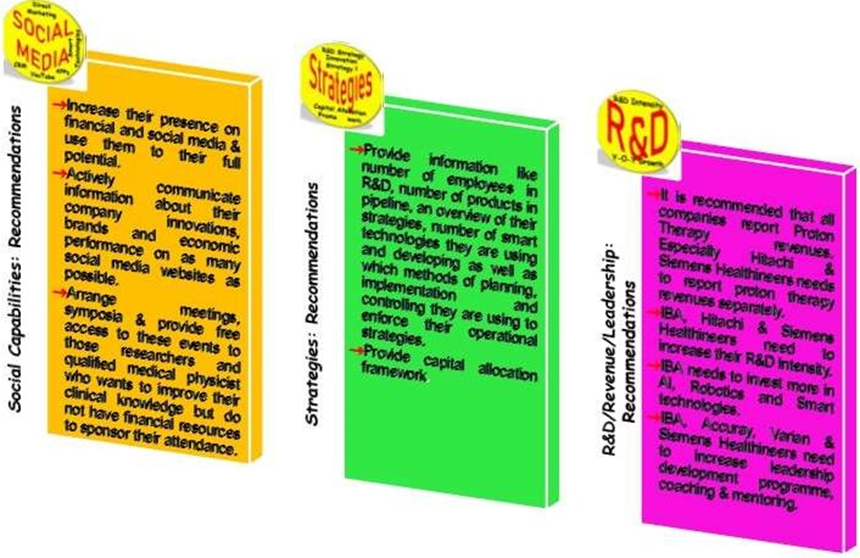
14. Accuray is using in total 9 channels. Varian and Siemens Healthineers are present on 12 channels. Hitachi is using all 14 channels. There is limited degree of coherence i.e., these companies are not supplying similar sort of information about a product or innovation through different channels. They are mostly using companies’ websites (News and press releases) to transmit information about a product line or service or brand. What they can do is actively use multiple social media channels to communicate their services to users including active blogs, Direct marketing, meetings and symposiums, Apps etc. On most of the social media channels, there presence is dormant and they are not using the channels actively and information there is not up to date. These companies are generally using 4 or 5 social media websites actively and this can be improved. As far as concept of Visibility or intensity of a product or service is concerned, there is limited impact and responsiveness of their products and brands in online channels and in social media communications. These companies do appear in browser searches which shows that they have reasonable online visibility. However, there is not lot of information available about them and their financial performances. Some specialized websites such macrotrends.net or technology related online News channels or Yahoo charts, Wall Street Market have limited data available on these companies. Ion Beam Applications SA is particular difficult to search online on some specialized financial websites such as macrotrends, net. On Wall Street Journal (WSJ), IBA is present but no financial data is available under Income statement, Cash flows and Balance sheet. It mostly exists on EURONEXT, Yahoo Finance, Financial Times (FT) and Reuters.com. Financial Times does not provide any information unless you subscribe to it as a user. It is recommended that IBA and its competitors increase their presence on financial and social media websites and also provide information like number of employees in R&D. It is also highly recommended to actively communicate information about their company innovations, brands and economic performance on as many social media websites as possible. It is also highly recommended that IBA and its competitors arrange scientific meetings, symposia and hands on practical experience and provide free access to these events and courses to those researchers and qualified physicists/medical physicist who wants to improve their clinical and technical knowledge but do not have financial resources or backing of an organization to access these meetings and hand on practical sessions. This will likely ensure that not only these talented and qualified personnel can enhance their clinical and technical skills but will help them to come back into industry. This will also enhance image of the vendors and they will also be able to use the expertise of these qualified and talented people in research and Industry.
Table II: Assessment of Social Capabilities of IBA, HTHI, VAR, SHL and ARAY
Platform and Data
Results are shown in Tables III-VII. One point is awarded for each platform.
Hitachi has the highest number of platforms i.e., 16. In second position is Varian with 8 platforms. In third place is IBA with 6 platforms. Siemens Healthineers and Accuray has 4 platforms each. IBA’s 6 platforms include first online and interactive Proton Therapy platform called Campus [69,10], SAP Human Resource central Platform, a web-based sales platform called CMMS [10], Pone, that is accounts payable automation tool, and Proteus® Platform [10] and LinkedIn Learning Platform [10]. Varian offers a CRM-based digital marketplace called Varian Marketplace for its customers where apps designed by third party developers are shared with Varian customers globally [70]. Other Varian Platforms include Halcyon system [36], True beam [36] and Edge Platform [36], cloud based OncoPeerTM platform [36] and OncoPeer community platforms [36], 360 OncologyTM [36], Noona software [34], Adaptive Intelligence Consortium [34] and Flash Forward consortium [34] and Cancer treatment Services International (CTSI) [34].
Hitachi’s 16 platforms are described in Table V. Hitachi’s Lumada provides Industrial IoT platforms and connects Hitachi technologies, advanced analytics and data management abilities to ensure customers can easily deploy and develop IoT solutions to achieve improved business outcomes [71, 72]. Hitachi’s IoT platforms were recognized as leaders in Gartner’s 2021 Magic Quadrant report [73]. Hitachi AI technologies
(H) have been applied in 57 projects in 14 areas including warehouse, Retail and call centre. Hitachi AI technologies resulted in 8% improvement in warehouse, 15% increase in sales in retail and 27% boost in order rates in call centre [74]. Through its Social Innovation business that consists of application of AI in various sectors including Smart life sector, Hitachi is trying to introduce society 5.0 and 4th Industrial revolution [75]. Here Hitachi is aiming to solve social and societal problems and thereby create social, economic and environmental value and improve quality of life of people. The Hitachi Digital Solution for Pharma/Biomarker Discovery helps healthcare and pharmaceutical sector in finding data driven biomarkers to foretell treatment efficacy with great accuracy [75]. Hitachi provides a number of AI and cloud based digital transformation, customer service and automation services to UK Government to ensure better delivery of services [76]. Hitachi provides expertise and training on how to use Microsoft Power platform to create custom build apps to its customers so that they can digitally transform their businesses or build apps to try enterprise-wide developments [46]. Hitachi Groupmax offers collaboration, workflow and system management solutions [77, 78, 79]. Work flow solutions decrease processing time for entire business and system management solutions reduce work load of management whereas collaboration solutions provide individuals in an organization access to information required to perform his/her duties whereas community work places allow information sharing within the community. Hitachi offers a number of Smart solutions [80]. Hitachi offers Client Process Automation -JP1/CPA that automates operations carried out on a PC [81]. In 2015, Hitachi presented Human Capital Management Integrated platform with a wide range of information about its human resources [24]. Hitachi Customer Relation Management (CRM) Includes Microsoft Dynamics 365 – A cloud-based CRM solution [82]. Hitachi has Centre for Technology Innovation (CTI) platform [83]. Siemens Healthineer Platforms include Teamplay Digital Health Platform [8], ARTIS Icono [8], Life Net- an innovative online system that assists labs enhance system utilization by providing a centralized platform to organize system maintenance and view service history of linked Siemens Healthineer systems [84], and AI-driven Guardian program to forecast system failures [85]. Accuray platforms include Radixact – Tomotherapy Platform [41], iDMS-Data Management System [41], CyberKnife Platform and OIS connect option [40]. The present study has shown that a number of Platforms are being introduced and used by all 5 companies. The study has found that these companies are using AI and other smart technologies. Hitachi has topped the list in terms of number of platforms as well as in use of AI, IoT and data analytics. Siemens uses AI Guardian Program, Accuray uses AI and robotic based CyberKnife technology, Varian uses Adaptive Intelligent Consortium. Siemens Healthineers has focused on investing in area of AI and digitalization and consequently now have 67 AI-based products on the market and 15 innovations in the R&D pipeline [8]. Examples include AI-Rad Companion and Syngo Carbon products. Siemens Healthineers’ Team play digital health platform support AI applications. The study has found that IBA does not particularly state which AI and Smart Technologies it is currently using or developing. This data is therefore not easily available and therefore difficult to obtain.
Table III: IBA Platforms and Data
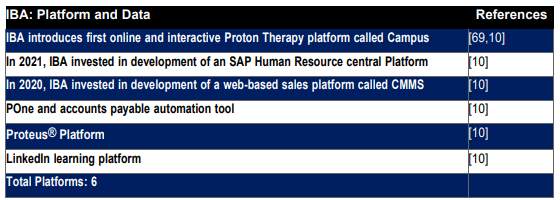
Table IV: Varian Platforms and Data
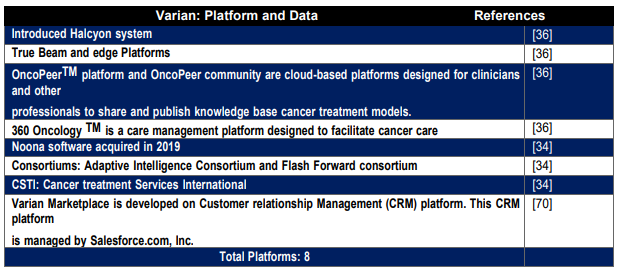
Table V: Hitachi Platform and Data
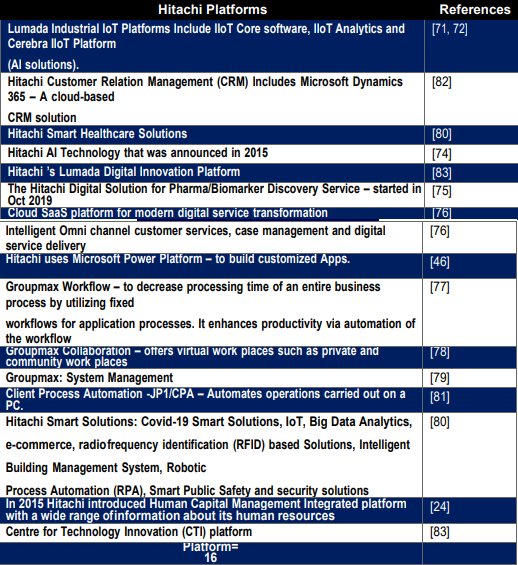
Table VI: Siemens Healthiness Platform and Data
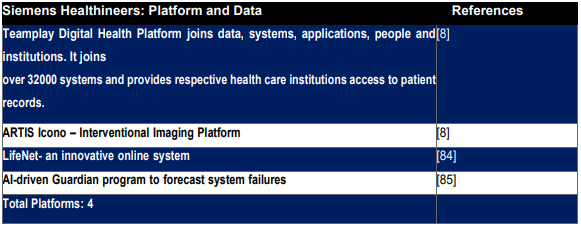
Table VII: Accuracy Platform and Data

Innovation leadership
IBA offers training for its managers so that they can become team coaches [45]. New training modules are offered to develop new coaching skills. Although IBA offers coaching but does not have a specific strategy to develop employees or management level staff into leaders. Therefore, IBA gets half points for leadership metrics. Having said that IBA leader – CEO Oliver Legrain has made sure that IBA continues to invest in R&D as part of their long-term growth plan. This means IBA will continue to come up with innovative products, improve existing products and ensure better price or high quality to its customer. Mr Oliver Legrain said in CEO message it wants IBA to embrace the values of responsible corporate citizen [45]. This means encouraging innovations that will bring more value to customers and share-holders. The data under metrics called Number of Innovations per year has shown that IBA is leader in proton beam therapy sector and has produced more innovations in 2022, 2021 and 2018 across all business segments compared to Varian, Siemens Healthineers and Accuray. This means IBA leaders including CEO has led the company to become an innovative leader in the industry. Author of the present study recommends that IBA introduces leadership programmes among its employees as well. Hitachi offers programmes such as mentoring, making change happen and internal consulting via Redsky learning to its leaders and managers [86]. Hitachi Rail and Vantara UK also offers mentoring circles [87]. Hitachi supervisors deliver coaching and feedback to their staff to assist them attain their targets [88]. Supervisors attain medium- and long-term development of employees by promoting continuous performance enhancement. Hitachi inspires employees to take ownership of their work and self-development. Hitachi develops employees for executive positions by providing both on the job training that also includes stretch assignments and off the job training that includes external training and coaching [88]. Hitachi has a program called “Future 50” via which they select 50 outstanding employees for management level leadership. The development of employees in Future 50 is fast tracked by assigning tough assignments and opportunities for direct discussion with independent directors [88]. Hitachi has a HR strategy called Global Human capital management strategy. As a result of this strategy Hitachi offers a common leadership development programme for employees around the world. It utilizes unified performance evaluation criteria. Therefore, Hitachi gets full points for leadership metrics. Siemens Healthineers offer its employees 1-2-1 personalised mentoring in order to direct them towards their goals [89]. Siemens Healthineers also provides and encourages job shadowing to support learning and growth of its employees [89]. Siemens Healthineers presents its employees with Top Talents (TT) program cultivates leadership dexterity, Entrepreneurial spirit, long-term global networks that are sustainable and possibility for a leadership career with international orientation among selected ambitious employees [90] Siemens Healthineers collaborates with Harvard Business Publishing to promote learning through knowledge application, presentations by organizational thought leaders and by aligning innovative projects with strategy and mentoring. Through Top Talents program siemens Healthineers selects aspiring employees with grand vision to be future leaders within the organization [90].
Varian has a compensation and leadership development committee [91]. Varian has a leadership development programme that trains high potential women for more senior leadership roles [92]. No information is available regarding employee mentoring and coaching programmes or about any other leadership development programmes. Accuray Incorporated offering mentoring opportunities by partnering with other organizations [93]. There is no further information available about mentoring, coaching and leadership development programmes. The present study has found a number of leadership development activities and courses are offered by these companies to its employees. It is recommended that IBA, Varian and Accuray increase and introduce mentoring, coaching job shadowing, and leadership programmes.
Strategy, Planning and Policies
Summary of strategies and policies are shown in Table VIII to XII. The strategies, Planning and Policy Metrix deals with R&D and innovation development strategies or policies, decision making on innovation products and development of innovation processes. Each policy counts towards one point and there are total 10 points to be awarded for having these policies and strategies. IBA pursue a long-term strategy to gain its goals of sustainable business growth and profitability [12, 94]. One of the ways to ensure profitability is to offer service offerings. IBA has adopted a strategy to intensify its focus on service offerings in order to increase revenue and gain competitive edge [95] IBA is also increasing its customer base offerings to ensure revenue stability and competitive edge in Proton Therapy market [95]. Examples of service offerings by IBA includes providing upgrades to current Proton Therapy users, maintenance services, support teams, 24/7 worldwide helpdesk support, hubs of experts and spare parts in every area, use of big data for predictive maintenance and dosimetry training to its customers. These strategies seem to work well for IBA as it has resulted in increased total revenues generated by the company in 2019 (Eur 282.552 million) from 2018 (Euro 257.407 million). Besides 45% of total revenue generated in 2018 was due to service offerings. In 2020 IBA held 42% Proton Therapy market share – Higher than all of its competitors. Many customers while deciding to purchase a product like to consider not only the price of the product but also what tangible and intangible benefits it offers. Service offerings play an important role in marketing as it delivers value to customers by providing intangible benefits. These strategies also ensure that if there is decrease in product sale then this loss may be offset by service offerings or customer-based offerings. In case of proton therapy which generally involves long and completed process of fulfilling orders, service contracts can help the situation by continuing to provide profitability. IBA wants to achieve sustainable growth by investing in R&D [45]. This is IBA’s long term growth plan. This is a very good strategy and will continue to ensure competitive edge over its competitors as well as is likely to make it a market leader in all of its business lines. This strategy is reflected in R&D intensity that has been 11% consistently over a period of 4 years from 2018 to 2021. This also means that IBA has consistently invested 11% of its revenue into R&D and IBA R&D Intensity is higher than Varian and Siemens Healthineers but lower than Accuray. IBA needs to increase its R&D intensity as currently its R&D year over year growth is zero i.e., no change in R&D intensity compared to previous year. This will likely increase its innovative product pipeline. IBA does not specifically and clearly provide in its reports or press releases any capital allocation framework. This makes it difficult to understand how the company intends to invest its capital. It would be good if in future reports IBA clearly states its Capital allocation framework. Although IBA works on a number of UN SDGs it still needs to incorporate SDGs into its strategy. A summary of IBA strategies and policies are listed in Table VIII.
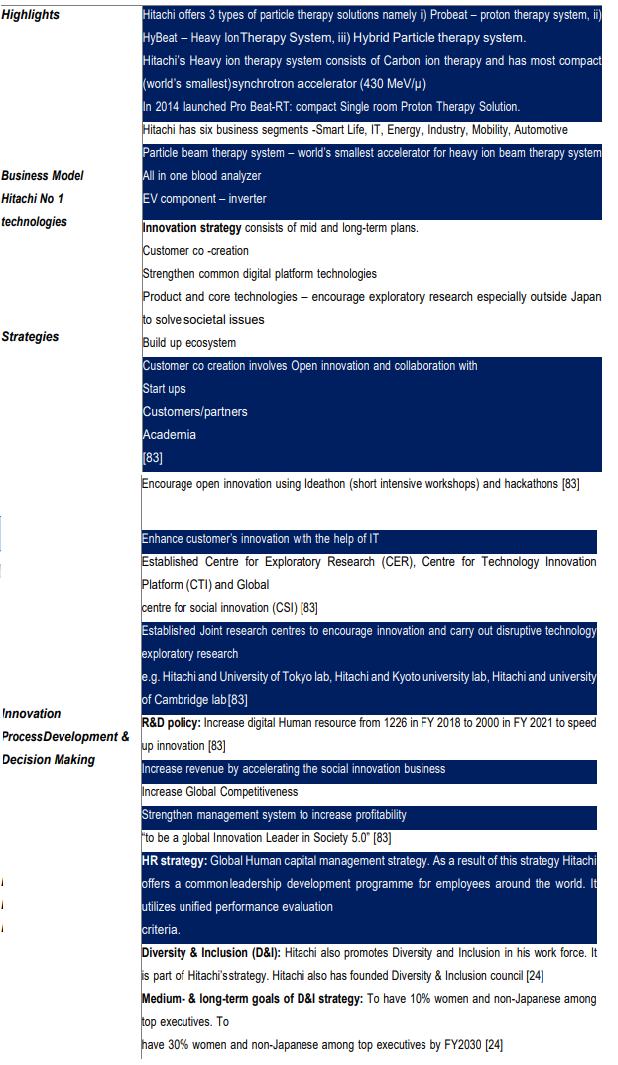
As part of Hitachi’s growth investment strategy, the company intend to increase the added value of Hitachi’s particle beam therapy system [24]. This falls under organic growth. Hitachi also intend to increase growth investment by increasing inorganic growth such as by carrying out Mergers and Acquision. Consequently from 2018 to 2021 Hitachi carried out almost 10 Mergers and Acquisions. From FY 2021, Hitachi is investing JYP 300 bn in cancer Radiotherapy, in-vitro diagnosis, pharmaceutical solutions, and medical data integration. In Cancer radiotherapy Hitachi intends to innovate in accelerator technology. Hitachi also wants to increase open collaboration with academia and start-ups [24]. According to mid-long-term management strategy, Hitachi uses undistributed profits in the areas of Mergers and Acquisitions, R&D, and capital expenditure to achieve competitiveness and to grow business [96]. A summary of Hitachi’s strategies and policies are given in Table.
IX. Siemens Healthineers also provide service offerings such as equipment performance management, clinical education, e-learning, asset management, consulting [8]. Other service offerings are given in area of digital AI- based products and solutions. Siemens Healthineers’ strategy to invest in acquisitions seems to have paid well. In 2020 Siemens acquired Varian and consequently its total revenue and EBIT adjusted revenue has increased significantly. Siemens Healthineers has a leadership model that associates 4 roles with the leader i.e. coach, manager, Expert and leader [97]. A summary of its strategies and policies are given in Table X. Varian strategy comprises of providing novel product innovation, technological leadership, value added manufacturing, global distribution of products and services and complete package solution of product and services [33]. Example of innovative product is Varian’s Pro Beam 360 compact single room accelerator [98]. Other examples of innovation are Halcyon which is IGRT guided VMAT system, True Beam RT system which provides HyperArc and RapidArc with 4d CBCT and Ethos Intelligent adaptive RT system [99, 100, 101]. This strategy enables Varian to compete well with its competitors some of them may have access to better financial and other resources. As Varian provides full package solution with its product this means that the price of its products is likely to be higher than its competitors. This in turn means institutions and organizations with limited budget or where decision to purchase new technology focuses on product price may choose products offered by Varian’s competitors. Overall, this strategy seems to work well for Varian as it considers itself leader in provision of medical linear accelerators in the field of radiation oncology. Varian’s strategy to expand into other markets seems to be working fine and has given Varian ability to drive its growth as well reduce its overall revenue loses. Varian expanded its business into interventional oncology market and ablation market by acquiring Endocare, Alicon, Boston scientific and CyberHeart in 2019. The decline in total revenue in 2020 compared to 2019 from USD 3.23 bn to USD 3.17 bn mainly due to oncology systems and proton therapy solutions was counterbalanced by increase in revenue from Interventional oncology. Varian recorded USD 0.03 bn increase in revenue in Interventional oncology segment in FY 2020 over FY 2019. Thus, Varian strategy to expand into other markets has reflected well in its total revenue in 2020. Varian focuses on developing new products in all of its business lines. The strategy to provide innovative products with superior clinical features such as precise treatment delivery, quick patient through put, better management of patient and organ motion, reduced patient time on treatment table, reduced monitor units, mobile access to patient imaging and treatment plan data, use of AI in predicting tumour motion and in calculating Biological effective dose or use of data analytics, user- driven designs, introducing fast and accurate linear accelerator developmental/production cycles and introducing more compact and cost effective particle therapy machines is likely to give Varian competitive edge over its competitors. By continue to introduce products that reflect varying customer demands and market trends will continue to give Varian (now part of Siemens Healthineers) and Siemens Healthineers a competitive edge. Provision of customer service and support to customers in oncology system business unit provides Varian with competitive edge over its customers. However, after the end of warranty period, some customers may choose to use their own in-house engineering and maintenance staff to deal with machine hardware and software related technical problems. Having said that the strategy to provide customer service and support to its customer may reduce customers’ worries to fail to resolve a technical issue. The customer service and support provide reassurance to Varian’s clients that timely help is available in case of any issue. The clients do not just need to rely upon their own expertise. They can use expertise of Varian’s staff to quickly and efficiently solve any technical or non-technical issues. This sort of help is especially valuable during early stages of a new product instalment as the expertise to handle and run new innovation may be limited within an organization. Table XI provides a summary of strategies and policies of Varian Medical Systems, Inc. Accuray like Varian also has a growth strategy that involves increase in sales in the current market and expand into adjacent markets. To achieve growth, Accuray also pursue strategic partnerships and joint ventures [40]. Accuray’s long- term priority is to acquire and maintain long-term profitability [102]. Its strategies and policies are listed in Table XII. This study has found that Hitachi, Ltd and Accuray, Incorporated provide Capital Allocation frame work but other companies do not. It is therefore recommended to outline a capital allocation frame work as well in their annual reports or sustainability reports. The study has also found that number of employees in R&D is not always stated in company reports or websites and in some cases this information has not been updated. The present study also found that companies generally do not provide innovations in pipeline and which innovations are made in house and which in collaboration. It is recommended that IBA and its competitors provide information regarding number of products in pipeline, an overview of their strategies, number of smart technologies they are using and developing as well as which methods of planning, implementation and controlling they are using to enforce their operational strategies.
Table VIII: IBA Strategies and policies Ion Beam Applications SA
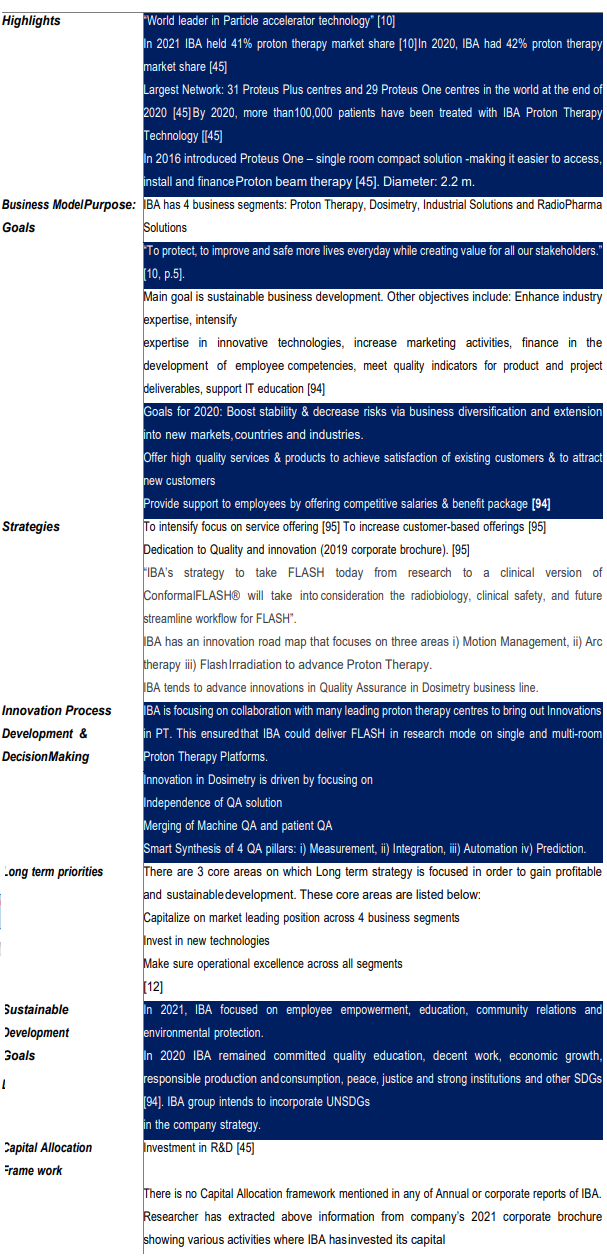
Table IX: Hitachi Strategies and Policies Hitachi Ltd
Capital Allocation Framework
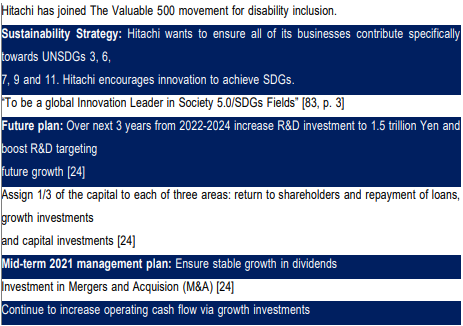
Table X: Siemens Healthiness Strategies and Policies Siemens Healthiness
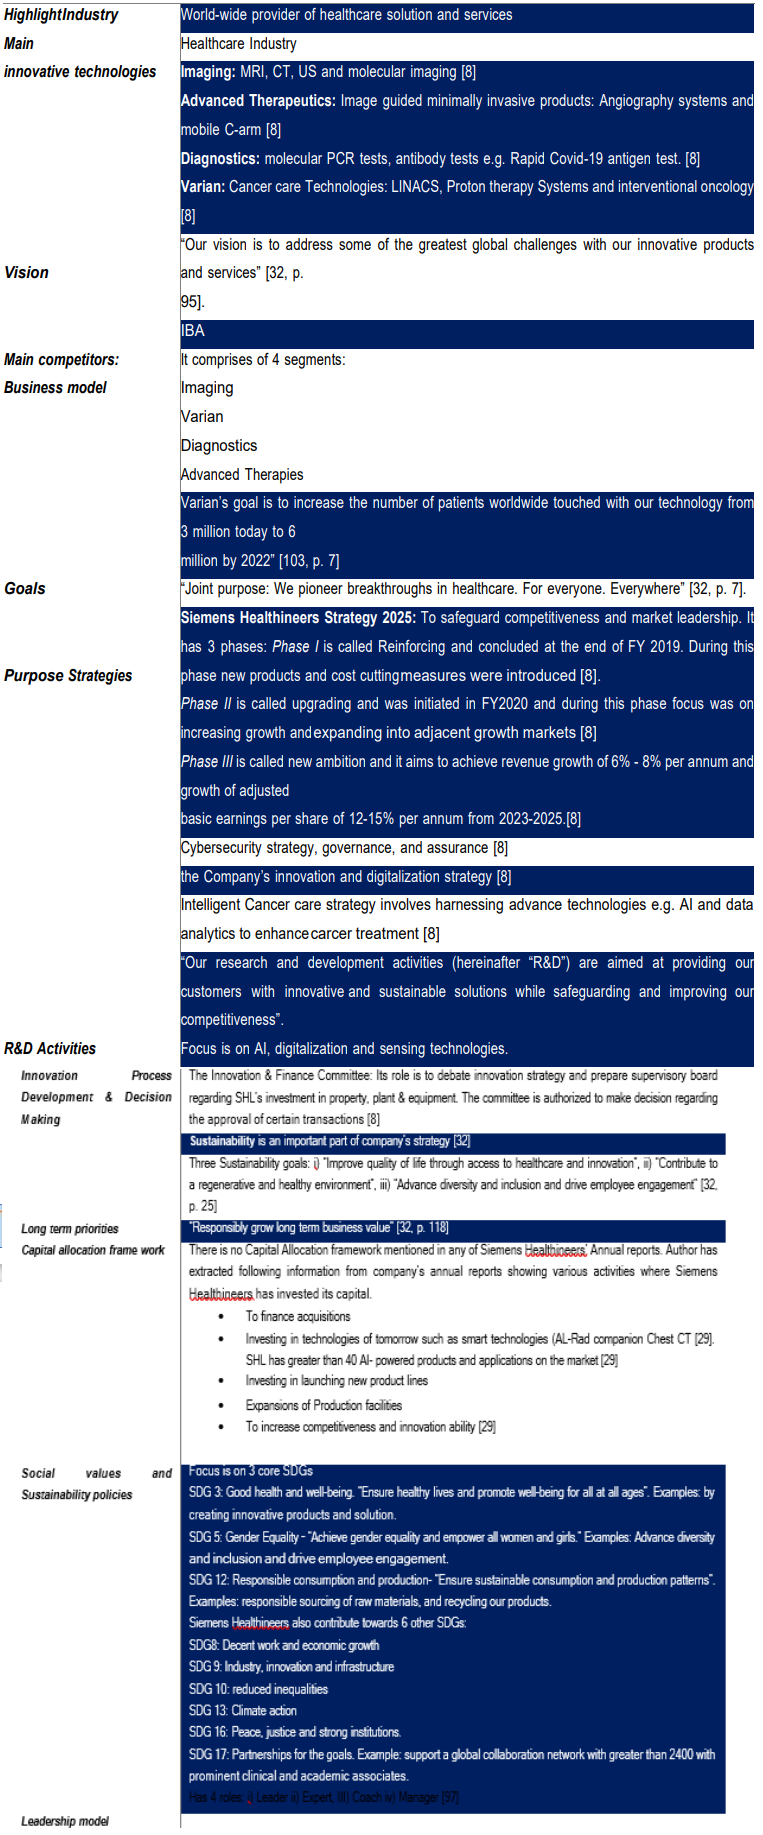
Table XI: Varian Strategies and Policies Varian Medical Systems, Inc.
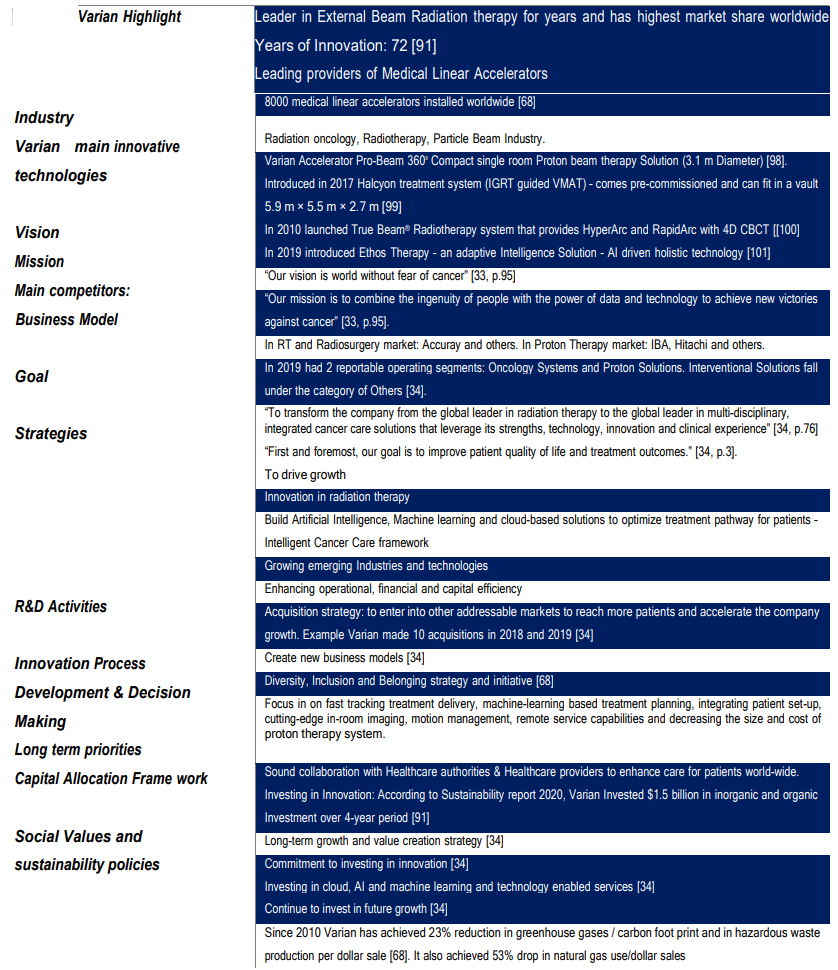
Table XII: Accuracy Strategies and Policies Accuracy Incorporated
- Innovation Activity
A number of metrics are discussed under Innovation Activity. These metrics include R&D expenses, R&D intensity, R&D Intensity Year-Over-Year Growth (additional metrics), R&D expenses Year-Over- Year Growth (Additional metric), Employees in R&D, Total number of Employees (additional metric), Number of innovations introduced per year, Ratios between the number of Innovations made in-house and number of innovations made in collaboration, Registered Trademarks and patents and Training and Educational improvements. IBA data was obtained from [9-22]. Hitachi Data was obtained from [24, 25, 104]. Siemens Healthiness data was obtained from ([8, 28, 29, 30, 31, 32]. Varian data was obtained from [ 33, 34, 35, 36, 37, 38] Accuracy data was obtained from [39-44].
R &D Expenses and Y-O-Y Growth
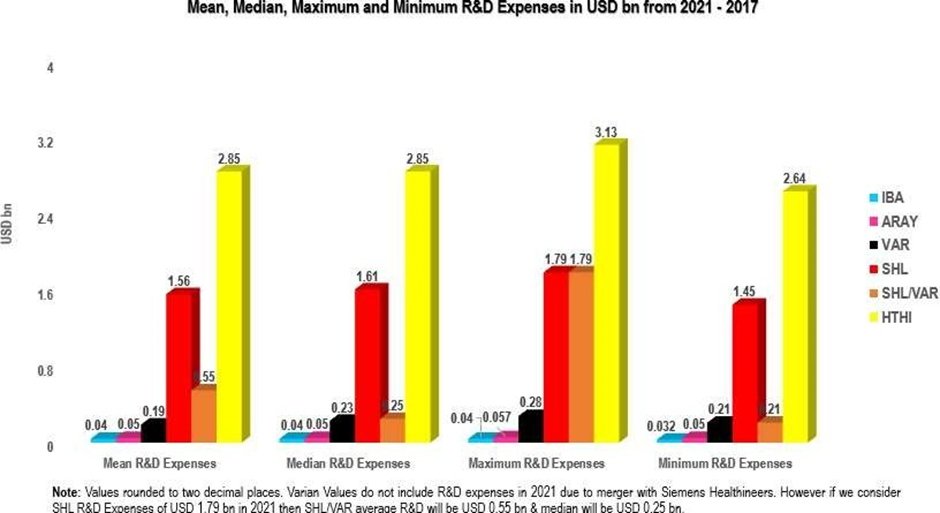
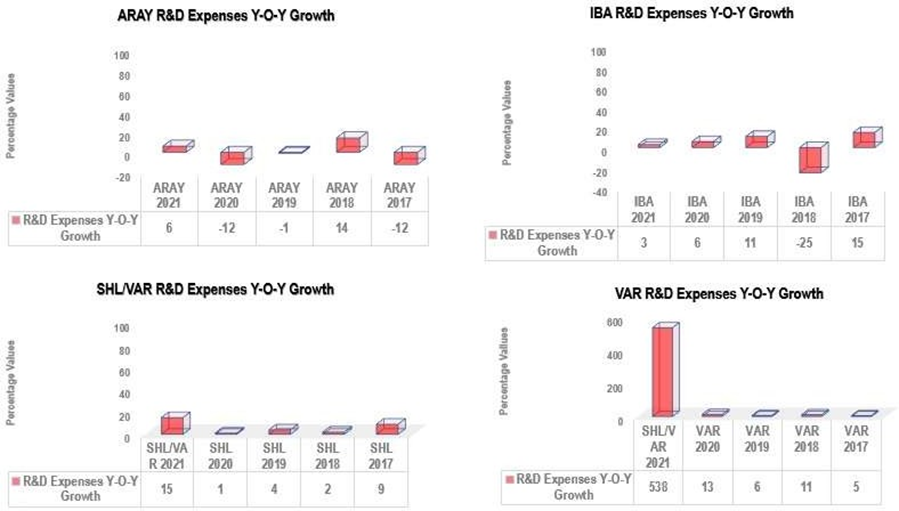
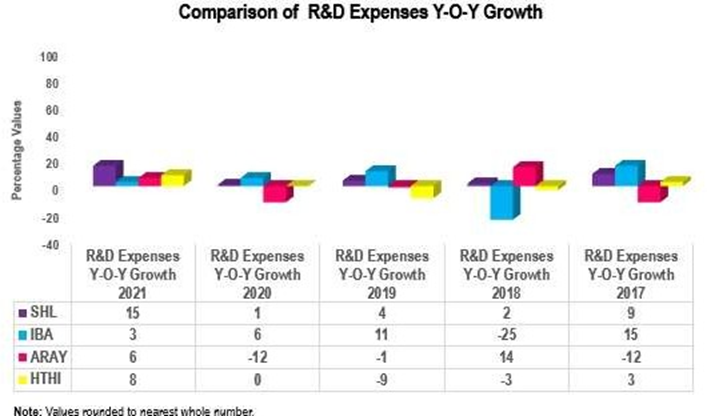
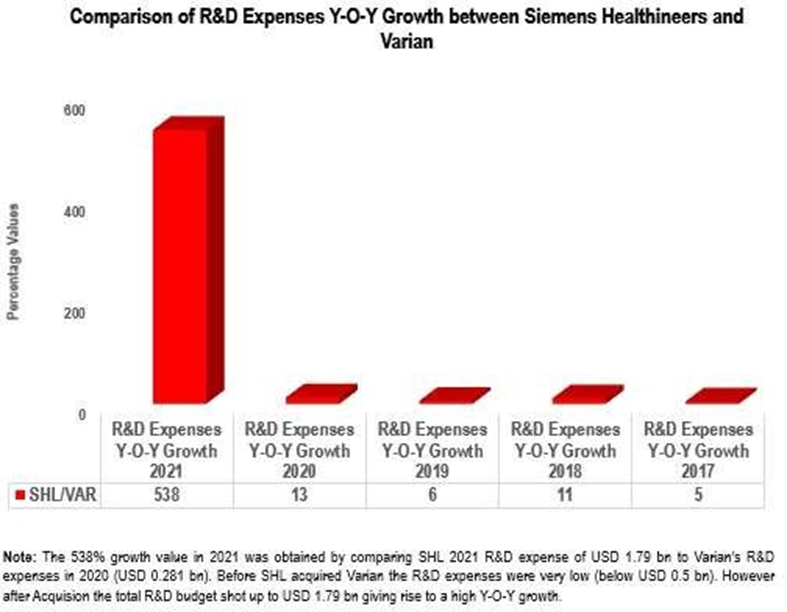
Results are shown in Fig.14 – 20.
IBA: R&D Expenses
IBA increased R&D investment by 2.5% (rounded to 3%) in 2021 compared to previous year. This means IBA had $0.038 bn invested in R&D in 2021. In 2020 IBA increased R&D investment by 6% compared to 2019 (R&D investment in 2020= $0.4 bn, R& D investment in 2019=$0.035 bn). In 2019, IBA had 11% increase in R&D investment compared to 2018 (R&D investment in 2018 = $0.032bn). However, 2018 was a difficult year for IBA and IBA R&D investment decreased by 25% compared to 2017. In 2017 R&D investment increased by 15% (R&D investment in 2017 =$0.044bn). Please note that due to lower Eur to USD exchange rate in 2021, R&D expenses when converted to USD appear less than previous year as shown in Fig.16. On average IBA invested $0.04 bn per year from 2021 to 2017. IBA’s median R&D Investment was $0.04 bn. The maximum and minimum R&D investment was $0.04bn and $0.032 bn from 2021 to 2017.
Hitachi: R&D Expenses
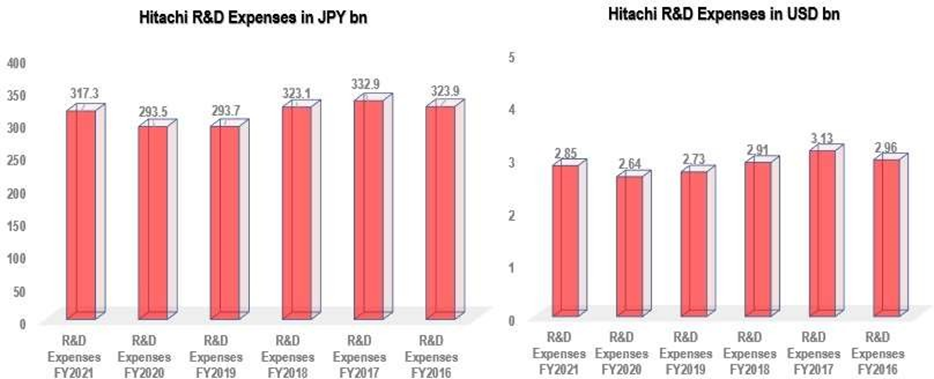
In 2021, Hitachi increased R&D investment by 8% compared to previous year. In 2020 there was no change in R&D investment compared to previous year. In 2019 and 2018 Hitachi saw a decrease in R&D Investment of 9 and 3%. In 2017 Hitachi increased R&D investment of 3% compared to previous year. On average Hitachi invested $ 2.85 bn in R&D investment from 2021 – 2017. The median, maximum and minimum R&D Investment was $2.85 bn, $3.13 bn and $2.64 bn respectively. In USD Hitachi invested $2.85 bn (JPY 317.3 bn), $2.64 bn (JPY 293.5 bn), $2.73 bn (JPY 293.7 bn), $2.91 bn (JPY 323.1 bn), $3.13 bn (JPY 332.9 bn) and $2.96 bn (JPY 323.9 bn) in FY 2021, 2020, 2019, 2018, 2017 and 2016.
Varian: R&D Expenses Varian has shown consistently increase in R&D expenses from 2017 to 2020 before its acquisition by Siemens Healthineers. In 2020, Varian R&D investment increased by 13% compared to 2019. In 2019 R& D investment increased by 6% compared to previous year. In 2018, the R&D investment increased by 11% and in 2017 the R& D investment increased by 5% compared to previous year. No R&D Investment data for only Varian is available after acquisition by Siemens Healthineers. Therefore, the researcher of the present study used R&D investment of Siemens Healthineers in 2021 which was $1.79 bn and compared it with Varian’s 2020 R&D investment. This gave rise to 537% rise in R&D investment from previous year as shown in Fig. 20. On average Varian invested $0.19 bn from 2020-2017. The median, maximum and minimum R&D investment done by Varian $0.23 bn, $0.28 bn and $0.21 bn respectively. These values cover 4-year period. Varian data does not include 2021 R&D expenses due to merger with SHL.
Siemens Healthineers: R&D Expenses
Siemens Healthineers increased R&D investment by 15% in 2021 compared to previous year. In 2020, R&D investment increased by 1%, in 2019, it increased by 4%, in 2018, it increased 2% and in 2017, it increased by 9%. Both Varian and Siemens Healthineers did not experience any decline in R&D investment compared to previous years over a period of 5 years. However, IBA, Accuray and Hitachi suffered at least once decline in R&D investment over the same 5-year period. SHL has second highest mean and median R&D expenses of $1.56 bn and $ 1.61 after Hitachi over a period of 5 years. Maximum R&D investment done by SHL were $1.79 bn and minimum R&D investment $ 1.45 bn.
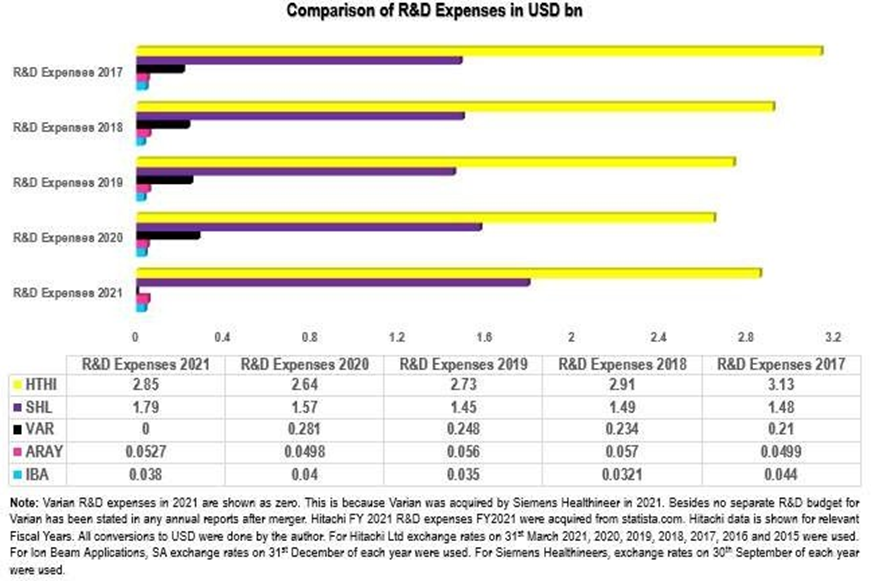
Accuray: R&D Expenses In 2021 Accuray R&D expenses grew by 6% or $0.0029 bn ($2.9 million) over 2020. In 2020 R&D expenses decreased by 12% or $0.0067 bn ($6.7 million) compared to 2019 mainly because of suspension of bonuses and lower compensation to employees. Other reasons for reduced R&D expenses were consequences of covid-19 pandemic i.e., reduced outsourcing expenses and lower travel costs because of covid-19 pandemic [41]. In 2019 R&D expenses decreased by 1% where as in 2018 it grew by 14%. In 2017, R&D expenses declined by 12% compared to previous year. On average Accuray invested $0.05 bn in R&D over a period of 5 years from 2021- 2017. The median R&D investment was also $0.05 bn. The maximum Accuray invested in R&D was $0.057 bn. The minimum R&D investment made by Accuray was $0.049 bn (rounded to $ 0.05 bn). Overall, in terms of R&D investment Hitachi made highest investment consistently in R&D followed by Siemens Healthineers, Varian, Accuray and Ion Beam Applications, SA.
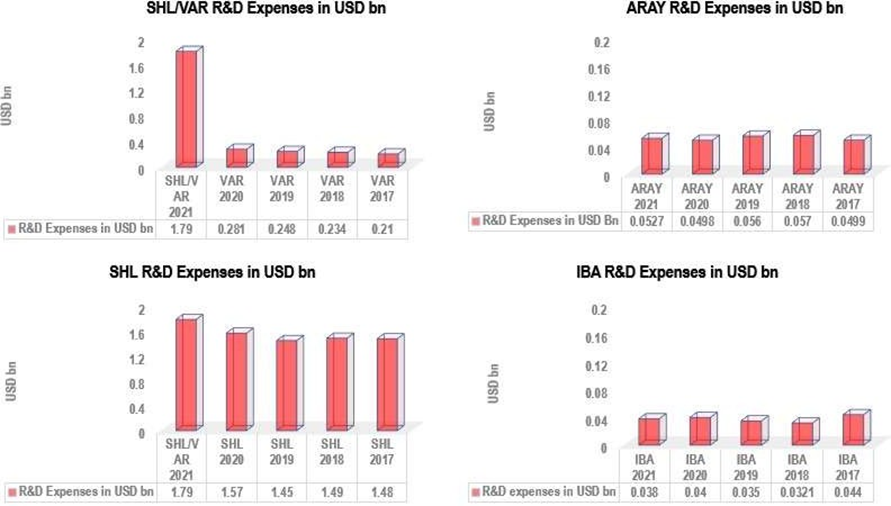
Note: IBA R&D expenses in 2021 appear lower than in 2020 due to lower Eur to USD exchange rate
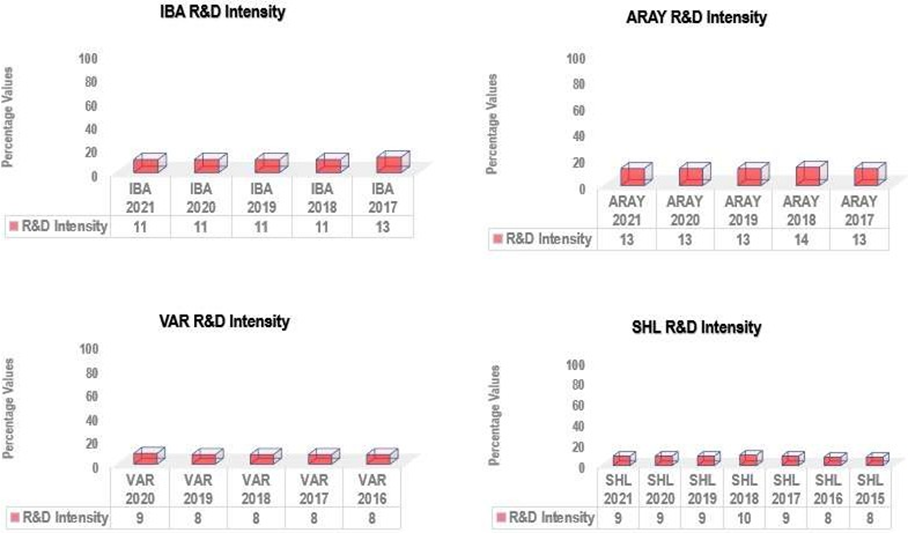
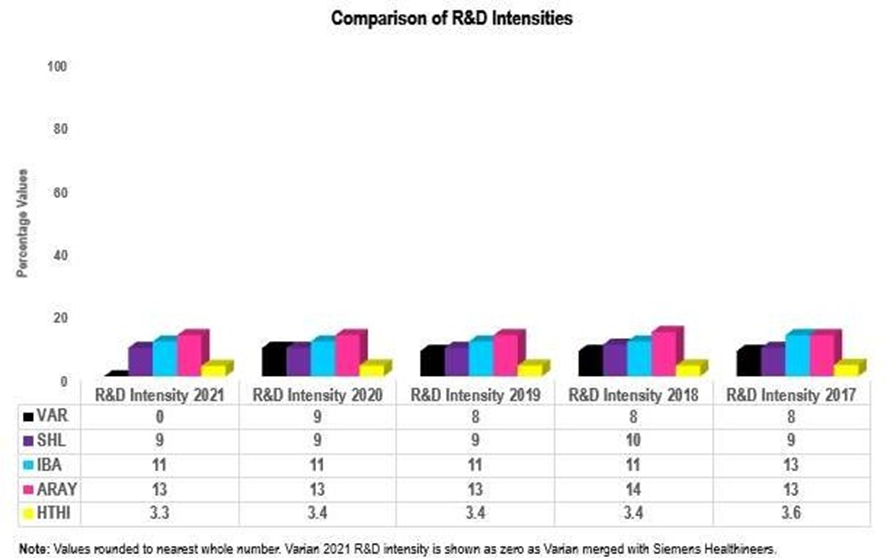
4.3.2. R&D Intensity: It is the ratio of R&D expenses to revenue. Results are shown in Fig. 21 – 23. R&D Intensity results include data from 2017 to 2021. Accuray has shown consistently higher R&D intensity compared to Hitachi, SHL, VAR and IBA. The lowest R&D values are shown by Hitachi. In the second place is IBA whereas in third place is Siemens Healthineers. In the fourth place is Varian followed by Hitachi. Accuray invested 13% of total revenue in 2021, 2020 and 2019 and 2017. It invested 14% in 2018. IBA invested 11%, of total revenue in 2021, 2020, 2019, 2018 and 13% in 2017. The R&D intensity for Siemens Healthineers was 9% in 2021, 2020, 2019 and 2017. The R&D intensity for Siemens Healthineers was 10% in 2018 where as it was 8% in 2016 and 2015. Varian R&D Intensity was 9% in 2020, 8% in 2019, 8% in 2018, 8% in 2017 and 8% in 2016.
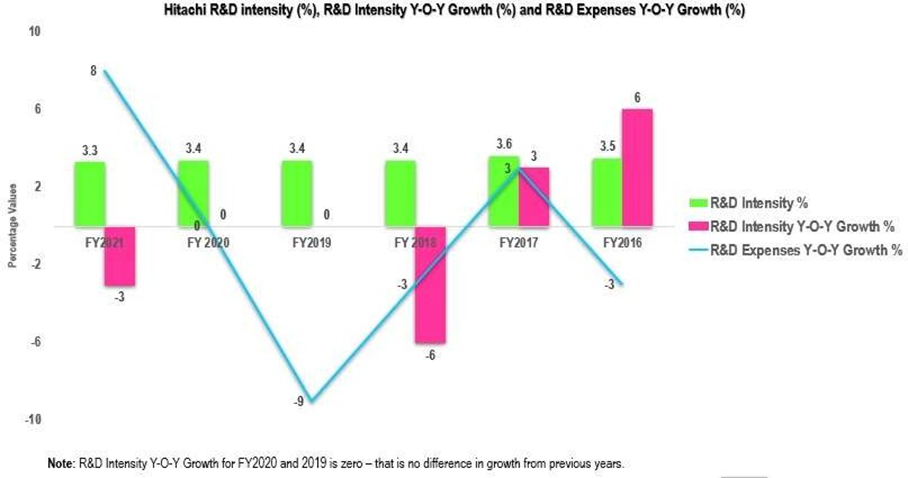
Hitachi R&D Intensity in FY 2021 was 3.3. The R&D Intensity was 3.3, 3.4, 3.4, 3.4, 3.6 and 3.5 In FY 2020,
FY 2019, FY 2018, FY 2017 and FY 2016.
R&D Intensity one-year Growth
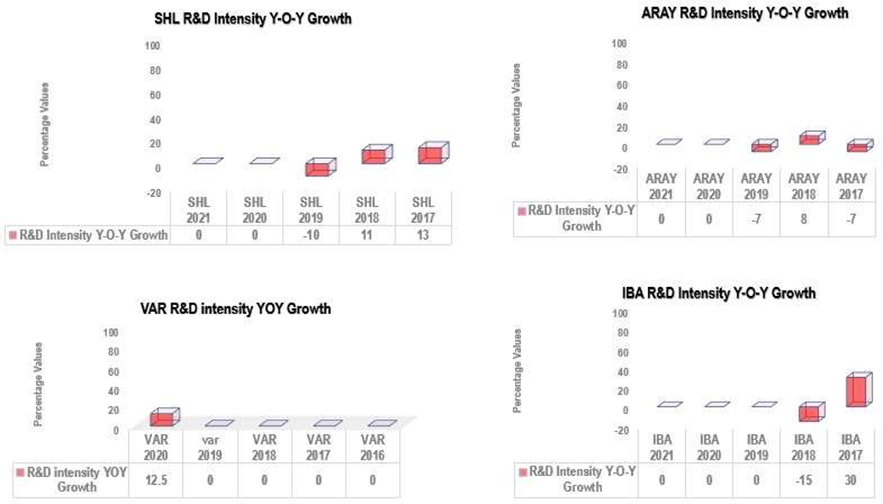
Results are depicted in Fig. 24. IBA, Siemens Healthineers and Accuray had no change in R&D intensity in 2021 and 2020 compared to previous year. There was no change in R&D Intensity for IBA in 2019 compared to previous year. In 2018 R&D intensity declined 15% compared to previous (2017: 30). In 2019 Siemens Healthineers R&D intensity decreased by 10% compared to previous years (2018: 11). In 2017, Siemens Healthineers R&D Intensity increased to 13% compared to previous year. There was an increase in Varian R&D Intensity of 12.5% in 2020 from previous year. There was no change in R&D intensity in 2019-2016 from previous years. Accuray R&D Intensity decreased by 7% in 2019 from previous year (2018: 8). In 2017 Accuray R&D Intensity decreased again by 7% compared to previous years. In case of Hitachi R&D intensity declined 3% in FY 2021 compared to previous year (2020: 0). In FY 2019 there was no change in R&D intensity compared to previous year. In FY 2018, the R&D intensity declined to 6% compared to 2017 (FY 2017: 3). In FY 2016 Hitachi R&D Intensity increased 6%.
Overall, it looks Varian is the only company that did not have a negative R&D intensity Y-O-Y growth from previous year in any year from 2020-2016. IBA had a negative R&D intensity Y-O-Y Growth in 2018, Siemens Healthineers had a negative R&D intensity Y-O-Y Growth in 2019 and Accuray had negative R&D intensity Y-O-Y Growth in 2019 and 2017. IBA is the only company that had highest increase in R&D intensity Y-O-Y growth. It was 30% increase in 2017.
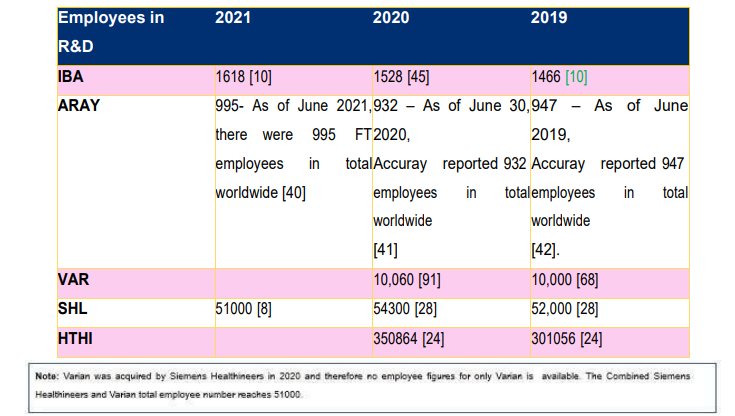
Employees in R&D and Total number of employees: Results are shown in Table XIII – XIV. Siemens Healthineers clearly has stated in its annual reports [8, 28, 29] total number of Employees in R&D. However other 4 companies have mostly failed to state number of employees in R&D. From the data available it seems Siemens Healthineer has highest number of employees in R&D i.e., over 10,000 in 2021, about 10,000 in 2020 and about 9000 in 2019. This translates very well in production of huge number of AI based applications and products. Hitachi has second highest number of R&D staff at the end of FY 2019 i.e., 2650. This may be the reason Hitachi has managed to produce highest number of innovations per year. IBA had 200 Engineers and experts in R&D in 2019. IBA R&D staff has managed to produce about 33 innovations from 2022 to 2018 which is very good performance. No data is available regarding Accuray R&D staff. As far as total number of employees are concerned it seems Hitachi has the highest number of Employees i.e., 350864. Siemens Healthineers have 51,000 total number of employees in 2021. Varian is in third place with total number of employees 10,060 in 2020 and 10,000 in 2019. IBA is in fourth place with 1618,1528 and 1466 total employees in 2021, 2020 and 2019. Accuray has lowest number of total employees i.e., 995, 932 and 947 in 2021, 2020 and 2019 respectively.
Table XIII: Number of Employees in R&D
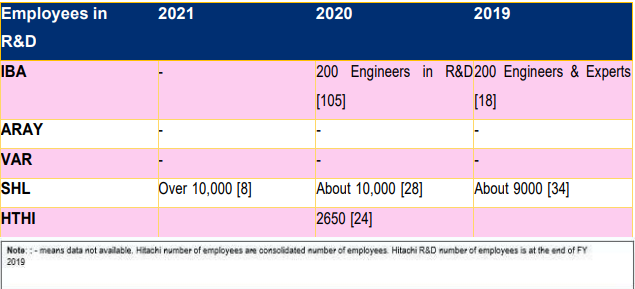
Table XIV: Total Number of Employees
Training and Educational Improvements
Education has moderate importance for IBA management and Leadership as shown by its Materiality Matrix [19]. IBA provides its employees training on radiation safety [19]. IBA also offers training on corporate ethics, human rights and policies to its employees [19]. IBA also offers wellness activities via its IBA Wellness Portal. The wellness activities offered by IBA includes walking, running, online training, exercise, nutrition tracking, health coaching tools, social features, wellness blogs, company announcements and other activities [45]. IBA also provides Employee Assistance program which includes practical information and counselling. In Dec 2021 IBA introduced INDux, a new training center designed to optimize customer and employee performance by maximizing talent, sharing knowledge and experiences [106]. IBA offers its employees technical training which is IBA job specific and individual skills deployment training which is IBA people specific training. IBA also offers young people education through various university programmes. IBA offers Civil biomedical diploma via Ecole Polytechnique de Louvain and Université Catholique de Louvain [107]. IBA uses HR management Tool called Talent Constructor for employee development. With the help of this tool each employee can chart an individual development path and follow it under supervision of a project manager or division director [94] In 2020 IBA trained 1240 employees. The types of training offered by IBA were 734 professional development, 114 certification and 392 foreign language courses in 2020 [94]. Hitachi on average invested JPY 66,900 bn in education/employee in FY 2020 [24]. Hitachi provides a common leadership development programme for its employees worldwide [24]. In order to place more female employees in leadership role, Hitachi set a target of 10% for the ratio of both women and non-Japanese among top executives and appointed 800 women in management roles [24]. To easily locate candidates for future leadership and management positions, Hitachi launched the human capital management integrated platform in 2015 where skills and career ambitions of employees are available [24]. Besides other activities, Hitachi nominating committee also opens discussions and individual interviews for developing candidates for future leadership and management positions. Hitachi has created Future 50 Group and members of this group receive one to one mentoring opportunities with independent directors to develop next generation ready to take over important positions [24]. Siemens Healthineers offer People and Leadership practices (PLP). Through PLP, employees are given opportunity to shape their own development and they can apply for any development programmes such as Siemens Healthineers Top Talent Program [90]. Varian offers safety training videos for manufacturing and field employees in local languages (Varian sustainability report 2019). Varian also offers product-specific electric courses field service engineers [68]. Varian offers internships to undergraduate and graduate students (Varian, university recruiting, 2022). Varian also offers its employees education and referral services and professional counselling via Employee Assistance Program [91]. Varian also encourages its employees to volunteer to increase awareness. Varian also provides its employees EHS courses such as Injury and Illness Prevention Program. Varian also provides Equipment specific lockout practices [91]. Not much information is available about employee training and courses in Varian reports and website. Accuray offers mentoring opportunities for example by partnering with healthcare business women Association [93]. Not much information is available on specific types of Employee training offered by Accuray.
Registered Trademarks and Patents
Results are shown in Tables XV -XIX.
All five companies have patents. Accuray Incorporated depends not only on patents but also on trade secrets, copyrights, trademark laws, non-disclosure agreements, contractual provisions and technical security measures [40]. Accuray reported in total 642 patents and patent applications in 2021. IBA reported more than 500 patents in 2019. No data for 2020 and 2021 available for IBA. Hitachi has over 2000 Patent cooperation Treaty (PCT) applications and over 600 solution inventions in 2021 [108]. Hitachi Metals reported over 600 patents in 2019 [109]. In 2020 Varian reported 1130 granted patents and patent applications where as in 2019 Varian disclosed 1055 patents and patent applications. Siemens Healthineers reported 23000 patent application and over 14,000 granted patents in 2021. Hitachi and Siemens Healthineers seem to have highest number of patents in the light of available data.
Table XV: IBA: Granted Patents & Patent Applications
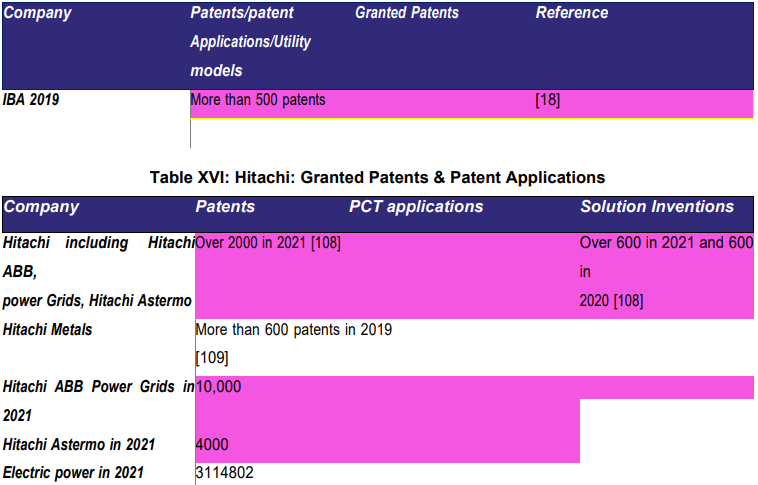
Table XVI: Hitachi: Granted Patents & Patent Applications

Table XVII: Accuray: Granted Patents & Patent Applications

Table XVIII: Varian: Granted Patents & Patent Applications
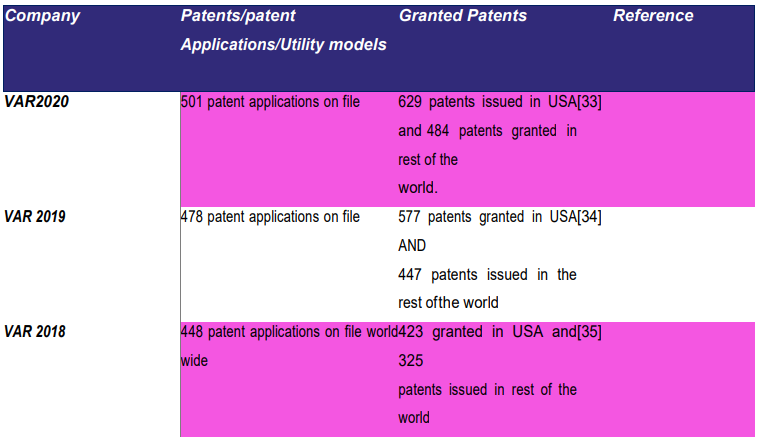
Table XIX: Siemens Healthineers: Granted Patents & Patent Applications

Ratio between in house innovations and innovations made in collaboration
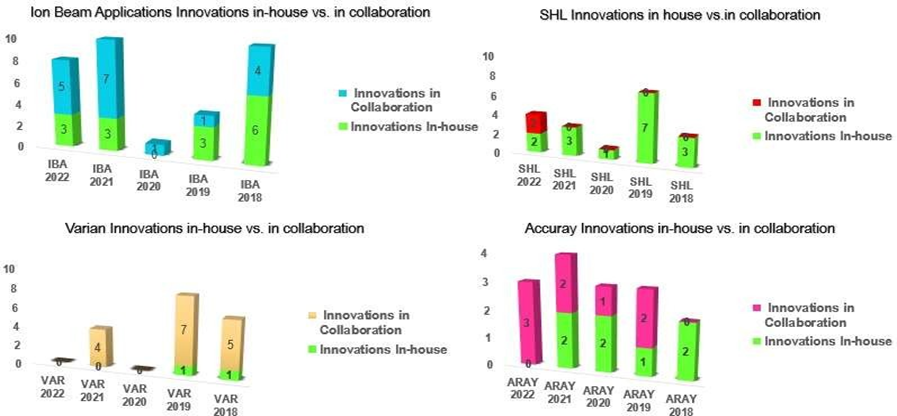
Results are depicted in Fig. 25 - 27. Innovations are shown in Appendices B, C, D, E and F.
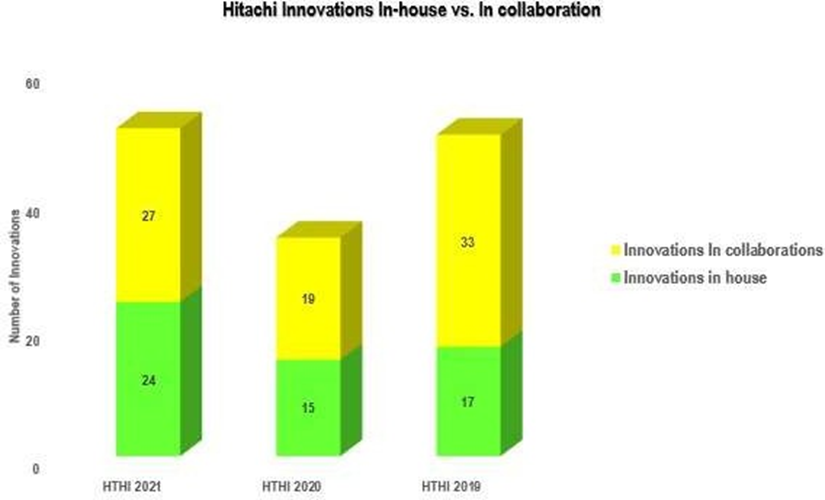
IBA data was collected from [11, 69, 18, 19, 110-133]. Hitachi data was obtained from [134]. Varian data for 2021 was obtained from [ 34, 35, 68, 135-143]. Siemens Healthineers data was acquired from [8, 29, 30, 144-155]. Accuray data for 2022 was obtained from [156-163]. Hitachi has highest number of Innovations made in-house as well as Innovations made in collaboration. Hitachi’s data is shown separately in Fig. 25. This could be due to the fact that Hitachi is much larger organization compared to other 4 companies as shown by its market capital and have many businesses from proton therapy to Rails, EV cars, Trains, Roads/logistics and many more. This could also be due to the fact that Hitachi has the highest mean value for R&D expenses over a period of 5 years from 2021 – to- 2017 compared to other 4 companies in this study. In Total Hitachi had 135 innovations from 2021 to 2019 (3-year data). Out of 135 innovations, 56 innovations were in house and 79 were in collaboration. Following formula is used to find ratios between In-house and in collaboration Innovations.
Total number of innovations = number of innovations in house + number of innovations in collaboration
Example
By Substituting the values in the above equation, we get:
51 = 24 + 27
number of innovations in house: number of innovations in collaboration
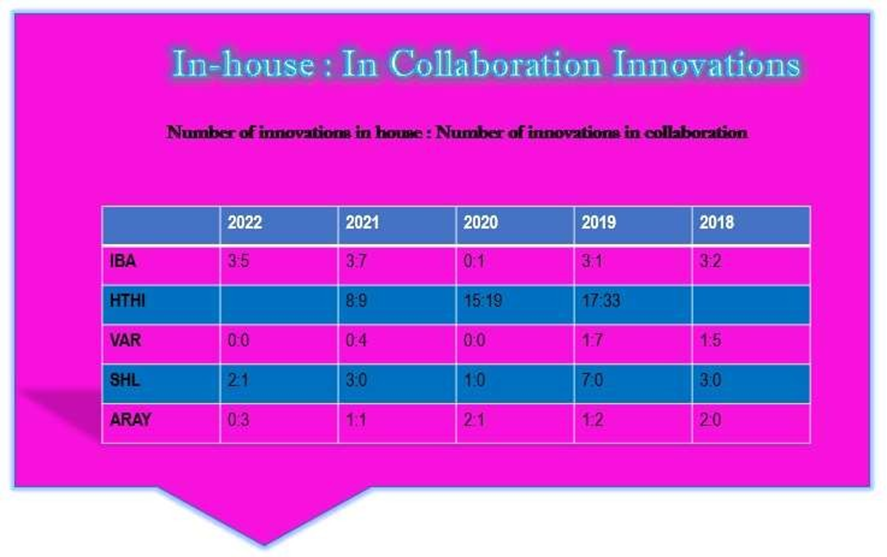
24: 27 = 24/27 = 8:9
This means the ratio of Hitachi Innovations made in house: made in Collaboration is 8:9 in its simplest form in 2021. Ratio of Hitachi Innovations in 2020 is 15:19 = 15/19. Ratio of Hitachi Innovations in 2019 is 17: 33 = 17/33.
Same method is applied to calculate the ratios for other 4 companies. See Fig 27. IBA produced more innovation in 2022, 2021 and 2018 compared to Varian, Siemens Healthineers and Accuray. The ratio between in-house and in collaboration innovations for IBA in 2022, 2021, 2020, 2019 and 2018 were 3:5,
3:7, 0:1, 3:1 and 3:2 respectively. In Total IBA had 33 innovations in 5 years. Out of 33 innovations, 15 were in house and 18 were in collaboration giving rise to a ratio of 15 innovations /18 innovations = 0.83.
Accuray performed better than its competitors in 2020 despite Covid-19 pandemic affecting businesses. The ratio between in-house and in collaboration innovations for Accuray in 2022, 2021, 2020, 2019 and 2018 were 0:3, 1:1, 2:1, 1:2, and 2:0 respectively. From 2022-2018, Accuray had in Total 15 Innovations. Out of 15 seven were in-house innovations and 8 were in collaboration. This gives us an overall ratio of 0.87. It seems that for Accuray the ability to produce in house and in collaboration innovations are almost equal. Varian and Siemens Healthineers had highest number of innovations in 2019 but in opposite order with Varian producing more innovations in collaboration and Siemens Healthineers producing more innovations in-house. The ratio between in-house and in collaboration innovations for Varian in 2022, 2021, 2020, 2019 and 2018 were 0:0, 0:4, 0:0, 1:7 and 1:5 respectively. Overall Varian produced 18 innovations in 5 years. Out of 18 innovations, two were in-house innovations and 16 were in collaboration giving rise to an overall ratio of 0.125. It seems Varian’s strength lies in collaborating with other companies.
The ratio between in-house and in collaboration innovations for Siemens Healthineers in 2022, 2021, 2020, 2019 and 2018 were 2:1, 3:0, 1:0, 7:0 and 3:0 respectively. In total SHL had 17 innovations from 2022-2018. Out of 17 innovations 16 were in house innovations. This is the highest in-house innovations compared to other 4 companies. It seems SHL had more capacity to innovative in house. Siemens Healthineers has in-house innovations/ in collaboration innovations = 0.9 which is nearly one.
Number of Innovations per year
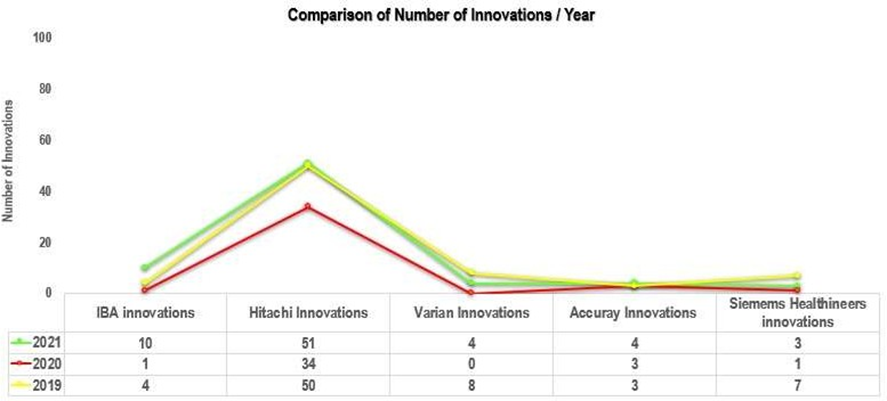
Results are shown in Fig. 28. Hitachi has consistently shown highest number of innovations per year including in 2020 during Covid-19 pandemic. IBA produced 10 innovations in 2021 putting it in second place after Hitachi. Siemens Healthineers produced 5 innovations in 2021 attaining third place while Varian was in fourth place as it produced 4 innovations in 2021. Accuray presented 3 innovations in 2021. Besides Hitachi, Accuray launched more innovations in 2020 compared to IBA (1 innovation), Varian (0 innovation) and Siemens Healthineers (1 innovation) during Covid-19 period. This shows that Hitachi and Accuray are very resilient and flexible organizations and managed to cope with COVID-19 side effects very well. After having not, a fine year in terms of innovations, IBA managed to bounce back with force in 2021 and this shows IBA’s ability to continue to keep generating great innovations and ability to invest in R&D. Number of innovations produced in 2019 were 4, 50, 8, 3 and 8 by IBA, Hitachi, Varian, Accuray and Siemens Healthineers respectively.
2. Radiation Oncology Market Overview
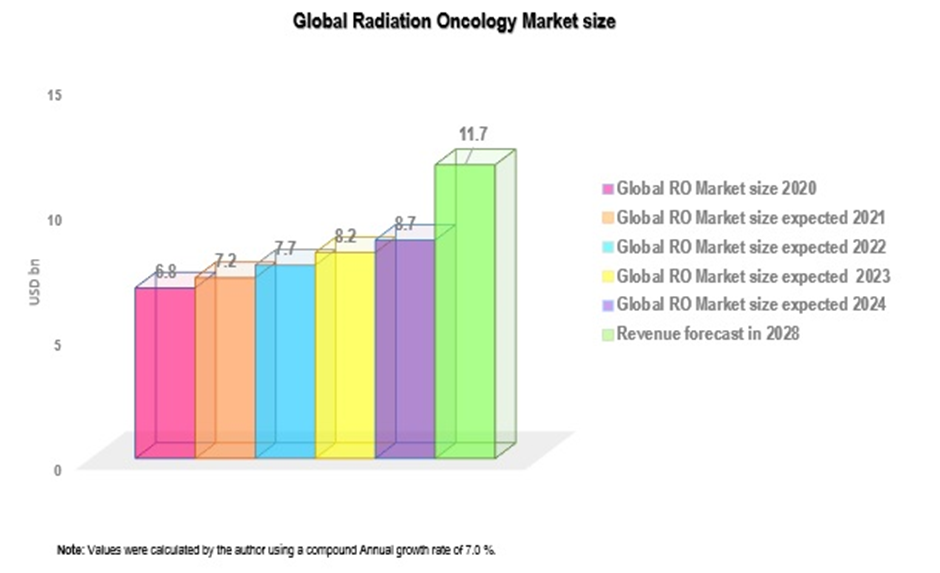
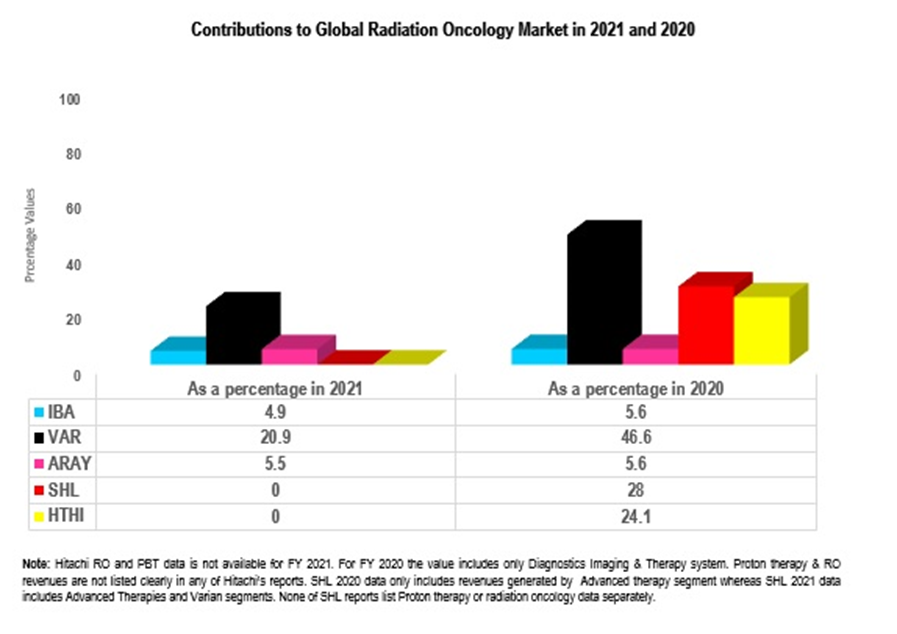
Results are shown in Fig. 29-30. Global Radiation oncology market size was $6.8 in 2020 and was expected to show a compound annual growth rate of 7.0% [164]. The author of the current paper calculated the expected Global radiation oncology market size in 2021, 2022, 2023 and 2028 using 7.0% annual growth rate. The author also calculated percentage contributions made by IBA, VAR and ARAY towards a $7.2 bn and $6.8bn global radiation oncology market in 2021 and 2020. Ion Beam Applications, Varian Medical systems, Inc and Accuray, Incorporated contributed 4.9%, 20.9% and 5.5% respectively towards global Radiation oncology market size ($7.2 bn) in 2021. In 2020, Ion Beam Applications, Varian Medical systems, Inc and Accuray, Incorporated contributed 5.6%, 46.6% and 5.6% respectively towards global Radiation oncology market size ($6.8bn). It is clear that Varian Medical systems, Inc contributed highest revenues towards global radiation oncology market. Siemens Healthineers contributions are not shown here as radiation oncology segment of Siemens Healthineers primarily is composed of Varian. (More over the combined Varian and imaging segments of siemens Healthineers contributed $12.88bn which is way over global radiation oncology market size in 2021). Revenue data was obtained from IBA Full year 2021 Results Presentation [9], IBA Annual report 2021 [10], IBA Reports Full Year 2021 Results [11]., IBA Reports Full Year 2020 Results [12], IBA Annual report 2020 [High definition] [17], Hitachi, Ltd. Hitachi Integrated Report 2021 [24], Hitachi, Ltd. Hitachi Investor Day 2021 [27]. 8. 06. 2021. Smart Life Sector. [Presentation]- [27], Hitachi, Ltd. Financial Highlights (IFRS) [25], Siemens Healthineers Annual Report 2021 [8], Siemens Healthineers Annual Report 2020 [28], 2020 Form 10 K Annual Report., Accuray 2021 [40], Annual Report and Accuray 2020 Annual Report [41]
3. Financial Market Analysis
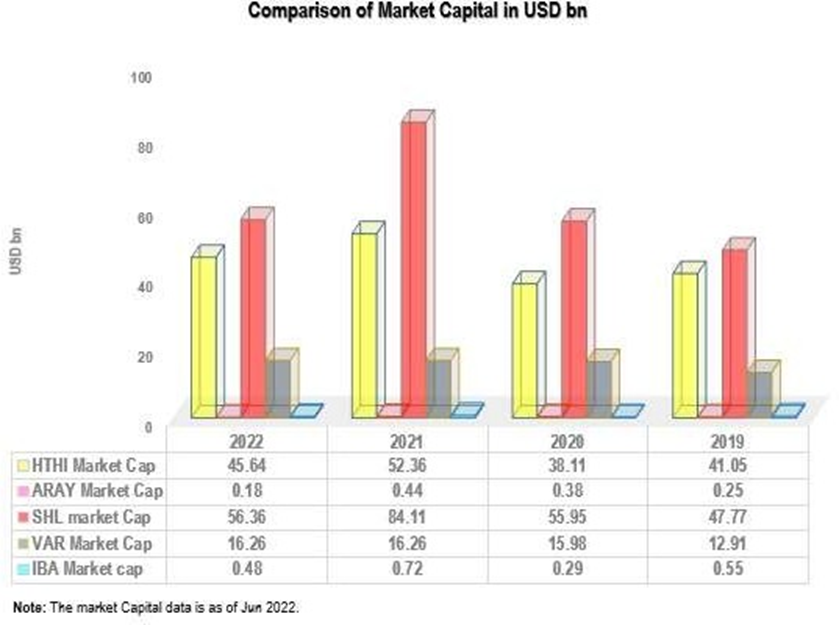
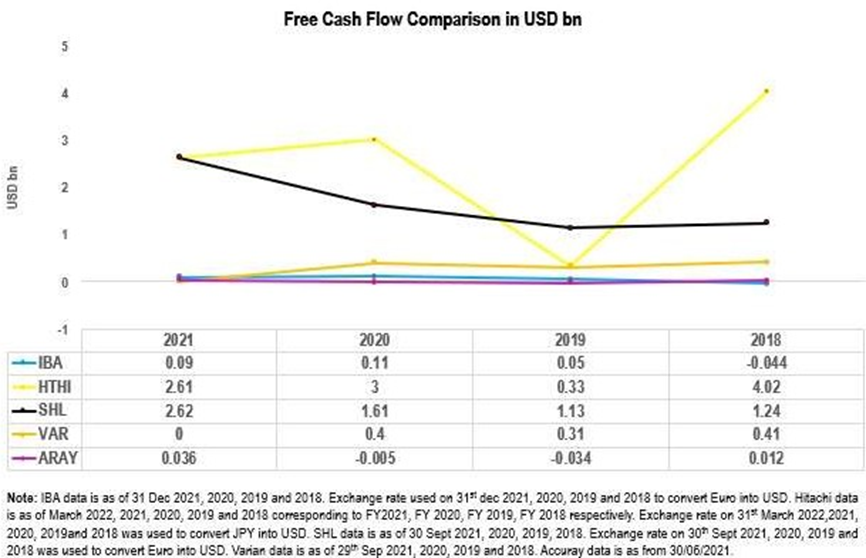
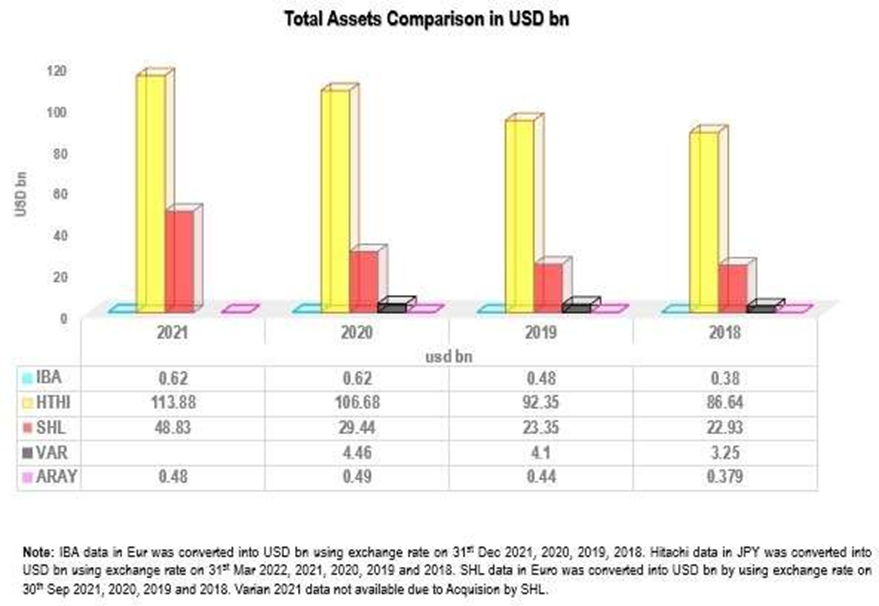
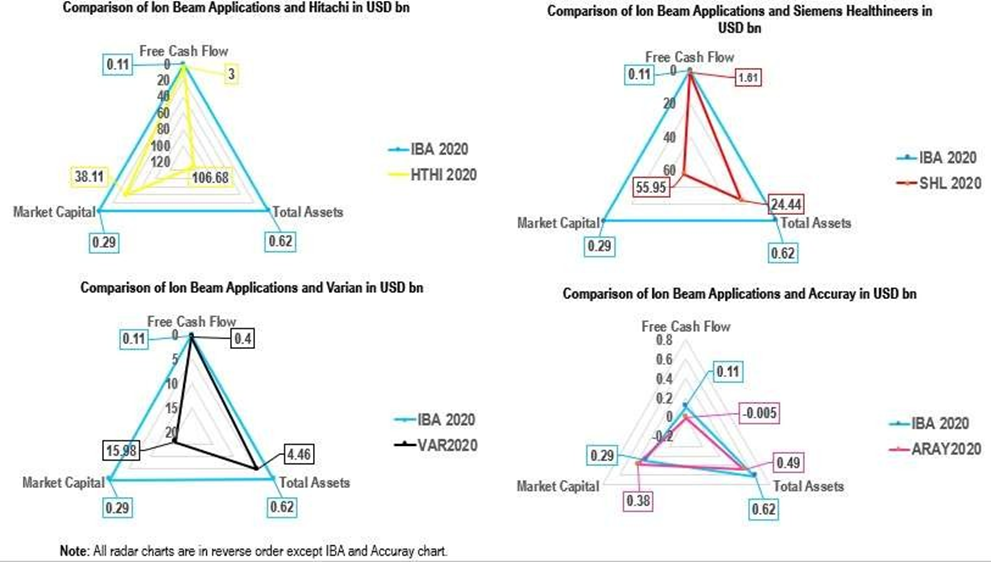
In order to see if IBA and its competitors have enough financial resources to commercialize inventions into innovations, to engage into entrepreneurial opportunities to maintain sustainability of the company and to face the economic and social challenges of the society, author has carried out financial market analysis that includes market capital, free cash flow and Total assets. These metrics are not part of Innovation leadership model. These are extra metrics analysed by the author. Results are shown In Fig. 31 – 34. Market capital data for IBA, Hitachi, Varian, Siemens Healthineers, and Accuray were obtained from [165, 166, 167, 168, 169]. Free cash flow data for IBA was acquired from [170]. Hitachi data was obtained from [24, 171]. Varian data was obtained from [172]. Siemens Healthineers data was obtained from [8, 29]. Accuray data was acquired from [173]. Total Assets data for IBA was obtained from [11, 13]. Data for Hitachi Total Assets was acquired from [24, 171]. Data for Varian Total assets was acquired from [33]. Data for Siemens Healthineers was obtained from [8,29]. Data for Accuray total assets was obtained from [40]. In terms of Market Capital, Siemens Healthineers has consistently shown to have highest market cap, followed by Hitachi and Varian from 2022 – 2019. IBA Market capital was at 4th position in 2022, 2021 and in 2019. In 2018 IBA market capital was lowest compared to other 4 companies. As of Jun 2022, market capital of Siemens Healthineers was $56.36 bn, of Hitachi was $45.64, of Varian $16.26 bn, of IBA $0.48 bn and of Accuray $0.18 bn. Other Market Capital values for 2021 and 2020 can be found in Fig. 31. Siemens Healthineer ($2.62 bn) has the highest free cash flow in 2021 followed by Hitachi ($2.61 bn), IBA ($0.09 bn) and Accuray ($0.036). In 2020, Hitachi had the highest free cash flow ($ 3 bn) followed by Siemens Healthineers ($ 1.61 bn), Varian ($0.4 bn), IBA ($0.11 bn) and Accuray (-0.005). In 2019 Siemens Healthineers had the highest free cash flow ($1.13 bn), HTHI ($0.33 bn), Varian ($0.31 bn), IBA ($0.05 bn) and ($ -0.034 bn). Accuray was the only one with negative cash flow in 2020 and 2019. This means Accuray spent more money than it made and was not left with any money after paying operating expenses during 2020 and 2019. In 2018, Hitachi had highest free cash flow ($ 4.02 bn), Siemens Healthineers ($1.24 bn), Varian ($0.4bn), IBA ($ - 0.044 bn) and Accuray ($ 0.012 bn). In 2018 IBA suffered from negative free cash flow. It seems 2018 was a tough year for IBA. Fig 32 shows free cash flow data for all 5 companies.
As far as Total Assets are concerned Hitachi reported highest assets ($ 113.88 bn) in 2021 followed by Siemens Healthineers ($ 48.83 bn), IBA ($ 0.62 bn) and Accuray ($ 0.48 bn). Varian data is not reported in 2021 as it was acquired by Siemens Healthineers in 2020. In 2020 Hitachi once again had highest Total Assets of $106. 68 bn, Siemens Healthineers reported $29.44 bn, Varian reported $ 4.46 bn, IBA $ 0.62 bn and Accuray reported $ 0.49 bn. In 2019 Hitachi reported Total assets of $92.35 bn, Siemens Healthineers reported $23.35 bn, Varian reported $4.1 bn, IBA reported 0.48 bn and Accuray $ 0.44 bn. Hitachi, Siemens Healthineers, Varian, IBA and Accuray reported $86.64 bn, $ 22.93 bn, $3.25 bn, $ 0.38 bn and $ 0.379 bn. Overall Hitachi has reported consistently higher Total assets compared to IBA, SHL, VAR and ARAY from 2021 to 2018. Siemens Healthineers secured second position as far as total assets are concerned. Siemens Healthineers consistently reported in the range of $48.83 to $22.93 bn. Varian total assets ranged from $4.46 bn to $ 3.25 bn from 2020 to 2018. Varian total assets increased from 2018 to 2020. IBA Total assets increased from 2018 to 2020. However, there was no change in total assets in 2021 compared to previous year. Total Assets of Accuray increased from $ 0.379 bn to $ 0.49 bn from 2018 to 2020. In 2021 there was a slight decline in total assets of Accuray.
1. Recommendations
Recommendations are shown in Fig. 35
Limitations of the study
A company’s innovation, flexibility and resilience can also be measured by utilizing financial data of past 3 years and by assessing it against the average financial performance sector wise. No Industry performance data is available for proton therapy. No R&D investment or intensity data industry wise or sector wise available. Author therefore could not compare R&D intensity of IBA, Hitachi, Varian, Siemens Healthineers and Accuray against the performance of Radiation oncology sector and proton therapy sector. Therefore, author could not determine contribution of each company to proton therapy market. This is also because not all companies report proton therapy sales separately. Limited Revenue projection data is available for Radiation oncology market. Consequently, author has compared the contribution of companies towards total Radiation oncology market.
Conclusion
In terms of points, Hitachi secured 1st position by achieving highest points of 257, followed by Siemens Healthineers who secured second position by attaining 106 points, Varian secured third position by attaining 102 points, IBA secured 4th position by achieving 97 points and Accuray was at 5th position by securing 72 points. All these companies have their own strengths. For instance, despite the fact that IBA revenues were lowest compared to other companies from 2021 to 2016, IBA showed greatest change in Revenues (YOY Growth %) in 2020 (10.4%), 2019 (10%) and 2016 (21.6%) compared to other 4 companies and therefore achieved 5 points for each year.
IBA contributed 5.6% and 4.9% towards the global Radiation Oncology Market in 2020 and 2021. Varian contributed 46.6% and 20.9% towards the global Radiation Oncology Market in 2020 and 2021 respectively. Accuray’s contribution as a
percentage towards Global Radiation Oncology market was 5.6% and 5.5% in 2020 and 2021. Siemens Healthineers contributed 28% in 2020 where as Hitachi contributed 24.1% in 2020. IBA and Accuray contributions are almost equal.
The present study has shown that IBA exhibits very good Innovation potential and capabilities despite being significantly smaller company than Hitachi and Siemens Healthineers in size and number of business lines. The financial data for the past six years shows IBA’s flexibility and resilience to both the environment and to economic, social and market requirements. IBA showed very good Innovation capabilities in terms of Proton therapy revenues as the PT revenues generated by IBA were greater than revenue contribution made by Proton Solutions segment of Varian from 2020 – 2018. This explains where IBA is an innovative leader in particle therapy sector and has many strong Innovative activities and Innovative capabilities. IBA owned 42% and 41% of Proton Market share in 2020 and 2021. IBA gives fairly good performance in terms of platforms and social media usage. IBA and its competitors have fairly good online visibility. However, this can be improved. IBA and other companies are not using social media websites to their full potential. In terms of innovation strategies IBA performed quite well achieving 8 out of 10 points. This means IBA has a number of good policies and strategies in place such as strategy that focuses on Dedication to Quality and Innovation, Conformal FLASH strategy, innovation road map, tendency to invest in R&D and new technologies as well as collaboration to drive innovation in the field of Proton Therapy. Innovation leadership matrix needs IBA’s attention as it secured only one point compared to other companies. In terms of Innovation activity, IBA showed very good change in R&D Investment in 2020 (6%) and 2019 (11%) compared to previous years. IBA performed consistently very well in terms of R&D Intensity as it has second highest R&D Intensity from 2021-2018 and highest R&D intensity in 2017 same as Accuray. IBA performed very well in Training and Educational Metrix and obtained 9 out of 10 points. This is one of the Metrix where IBA performance outclassed its competitors. IBA provides lot of training to improve skills, knowledge and competences of its employees and its reflected in number of innovations it has managed to produce per year. Despite having only 200 engineers and Experts in R&D (2019) which is smallest number of staff dedicated to innovation, IBA still managed to excel in total number of innovations from 2022- 2018 over Siemens Healthineers (17), Varian (18), and Accuray (15). It has produced 33 innovations in nearly 5 years which is very good indicator of Innovation activity. Hitachi had 135 innovations from 2021 to 2019. However, Hitachi is way bigger company than IBA with highest revenue, market cap and number of Employees dedicated to R&D (350864). Areas where IBA needs to improve involve AI, robotics and digitalization, number of patents, number of leadership programmes offered to its employees and overall R&D intensity YOY Growth, use of social media including Apps, CRM, direct marketing and Smart technologies.
In terms of financial market analysis, IBA had an average Market Capital of $ 0.51 bn over a period of 4 year. This is lower than its competitors in the present study. Hitachi average Market cap was $44.29 bn. The average market capital of Varian was $ 15.35 bn whereas average market capital of Siemens Healthineers $208.36 bn. The average market capital of Accuray was $0.31 bn. IBA has access to reasonable free cash flow to continue its operations. In 2018 IBA suffered negative cash flow which meant it spent more than it made. Siemens Healthineers has highest cash flow in 2021 followed by Hitachi ($2.61 bn), IBA ($0.09 bn) and Accuray ($0.036). As far as Total Assets are concerned Hitachi reported highest assets ($ 113.88 bn) in 2021 followed by Siemen Healthineers ($ 48.83 bn), IBA ($ 0.62 bn) and Accuray ($ 0.48 bn). IBA Total assets increased from 2018 to 2020. Overall Hitachi performed well in Revenues (highest mean values), change in Revenue (2nd highest value in 2021), Social Media usage (highest number of social capabilities – 14/14 points), highest number of Platforms and 57 AI products, innovation leadership ( offers a number of leadership programmes to its employees), Full points for Strategies and policies concerning innovation, Highest R&D investment mean value, R&D staff dedicated to innovation (second highest number after SHL), highest number of total employees, highest number of patents, innovations per year and innovation ratios. This shows Hitachi has great Innovation capabilities and activities and is very resilient to economic, social and financial environment. Hitachi can work to improve its R&D intensity and education and training courses that they offer to their employees.
Varian performed well in Revenues YOY growth in 2019,2018 and 2017, secured second position after IBA in Proton therapy sales, is using 12 social media websites and managed to produce 8 platforms, got 8/10 for innovation strategies which is pretty good. Varian showed very good innovation activity in terms of total innovations (18 innovations from 2020 to 2018). This mean on average Varian produced 4.5 innovations per year. Varian needs to improve overall mean Revenue and R&D expenses although they are better than IBA and Accuray. Varian also needs to provide information on staff in R&D. Varian needs to improve on Education and training that they offer their employees. SHL performed well in terms of mean Revenues and changes in revenues. It also performed well in social capabilities area (12/14 points). SHL showed very good Innovation related strategies and secured 9 out of 10 points. SHL had highest number of staff in R&D, had second highest number of patents after Hitachi and managed to produce 17 innovations in total from 2022 -2018 with an average of 3.4 innovations per year. SHL need to focus on improving social capabilities further, need to offer more leadership programmes although its
leadership programmes are more than those offered by its competitors like Varian, IBA and Accuray and need to increase R&D intensity. Accuray needs to provide information about staff in R&D, need to offer more leadership programmes and increase the number of training courses offered to its employees. Accuray had highest R&D intensity among its competitors even better than Hitachi from 2021 to 2017. Accuray excelled well in revenue YOY growth in 2018 and 2016. Accuray uses 9 platforms out of 14 and produced 15 innovations in total from 2022-2018 giving rise to a mean value of 3 innovation per year. Accuray has shown fairly good innovation capabilities and activity and has performed very well in 2020 despite Covid-19 pandemic affecting businesses all over the world. Accuray provides a clear timeline of its innovations and excels in Robotic CyberKnife, Tomotherapy and Radiosurgery market.
Declarations
Author Affiliations
PhD Student Swiss School of Business Research Switzerland, Qualified Research Medical Physicist & Certified International Project Manager from American Academy of Project Management, USA
Acknowledgment
I would like to express my deepest gratitude to my Research Supervisors Dr. King and Dr. Mallon for providing professional support and guidance to ensure successful completion of this research project. I would also like to extend special thanks to Dean of the University Dr Stephen Harrison for his invaluable guidance and unwavering support throughout the project and prior to enrolment.
Statement of Original Authorship: The work contained in this research paper has not previously been submitted for a degree or diploma at any other Higher academic Institute to the best of my knowledge. The research paper does not consist of material previously published or submitted for publication by another person except where due reference is made.
Signed:

Date: 13/09/2022
Auj-E Taqaddas
Conflict of Interest
Author discloses no conflict of Interest
Ethical Considerations
The project idea was approved by the Supervisor and Dean of Swiss School of Business Research, Switzerland. The project does not require ethical approval and it is IRB exempt.
Funding
No Funding or Financial Support was taken to carry out this research.
Implications & Contribution to Knowledge: The research paper provides information on how innovative medical device manufacturers in Radiation oncology, Medical Physics and Proton Therapy industry are. The paper also provides information about areas where these organizations excel and where these organizations need to focus more to enhance their own innovation leadership in the industry. The paper highlights the contribution of these companies towards global Radiation Oncology market. This in turn is likely to ensure their competitiveness and survival in the Industry. More over Innovation comparison ensures that these companies continue to invest in R&D to produce innovative products and enhance existing products and services so that better diagnosis and treatment can be provided to cancer patients. No previous research comparing the innovative leadership in medical device manufacturers in Radiation Oncology, Medical Physics and Proton Therapy industries has been carried out to the best of the knowledge of the author. This report is likely to encourage all these companies to come up with improvement in existing products and services and to launch innovative products to deal with real life issues in an efficient and cost-effective manner and to meet the needs and demands of users of their technology by employing smart technologies.
Author’s contribution: Auj-E Taqaddas conceived the study idea, collected data, analysed data, produced the report and manuscript. Dr. King and Dr Mallon checked the draft and final report and approved the manuscript. Dr. Harrison oversaw the whole project and PhD process.
Supplementary Data: Supplementary data related to this paper can be found below:
Supplementary Data
Supplementary data related to this paper can be found below:
Appendix A: Exchange Rates
Table XX Currency Exchange Rates
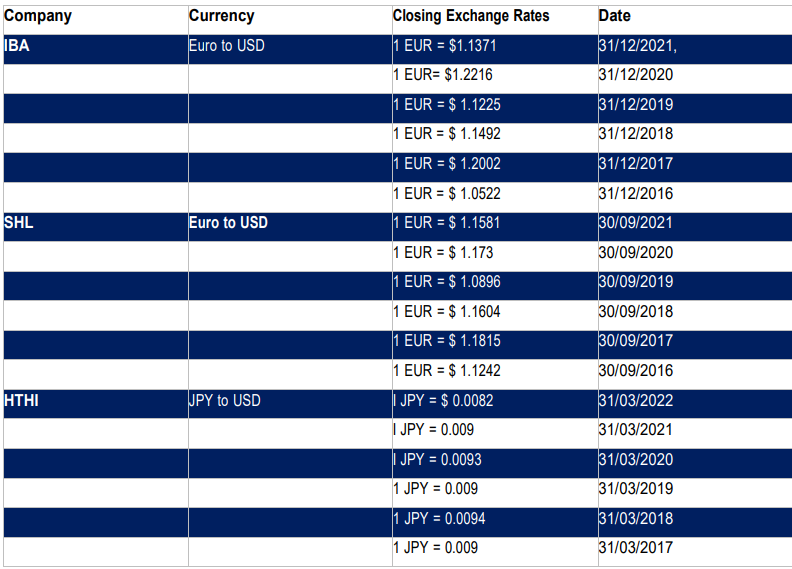
Appendix B: IBA Innovations
Table XXI: IBA Innovations in 2022
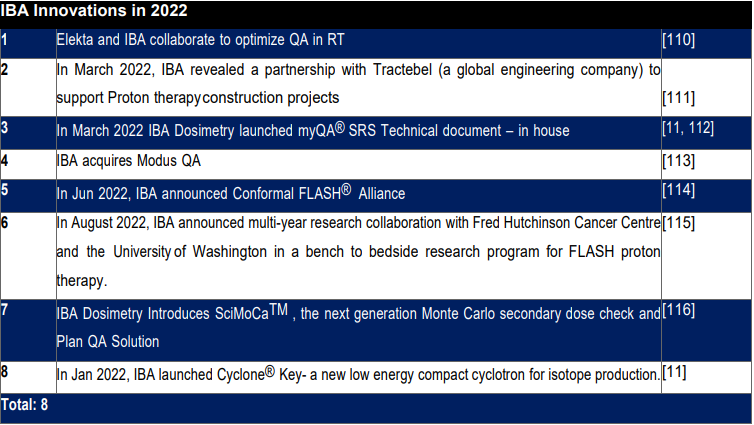
Table XXII: IBA Innovations in 2021
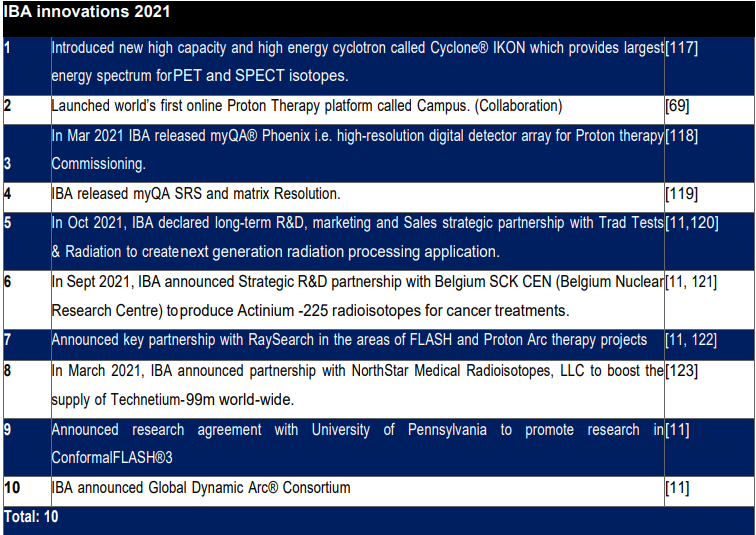
Table XXIII: IBA Innovations in 2020 and 2019
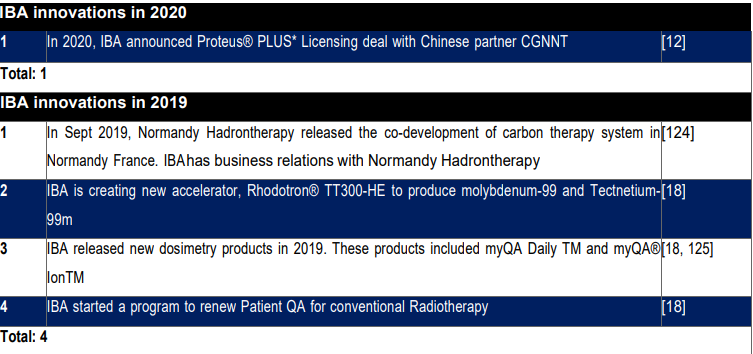
Table XXIV: IBA Innovations in 2018
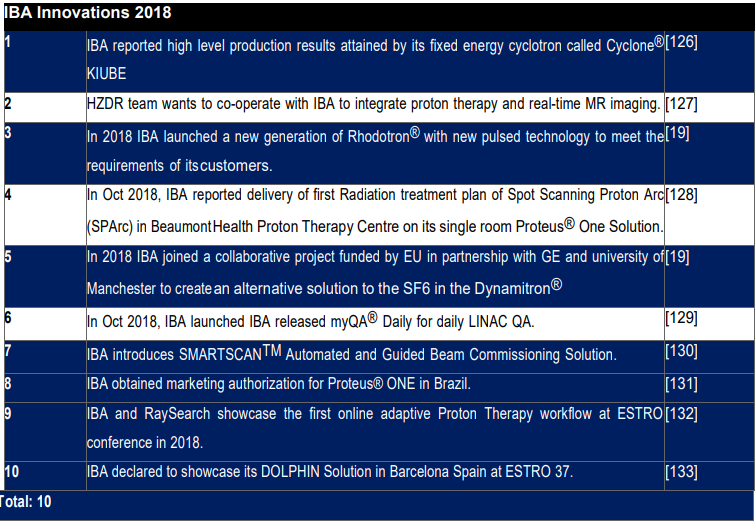
Appendix C: Hitachi Innovations
Press release headlines or Excerpts from the press releases are cited below to show various innovations launched by Hitachi, Ltd. All press releases can be accessed from Hitachi’s website.
Table XXV: Hitachi Innovations in 2021

Table XXVI: Hitachi innovations in 2020

Table XXVII: Hitachi Innovations in 2019

Appendix D: Varian Innovations
Table XXVIII: Varian Innovations in 2021
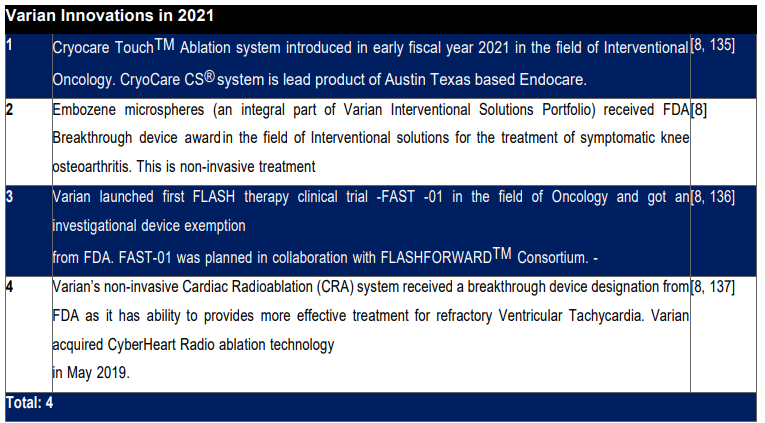
Table XXIX: Varian Innovations 2019 and 2018
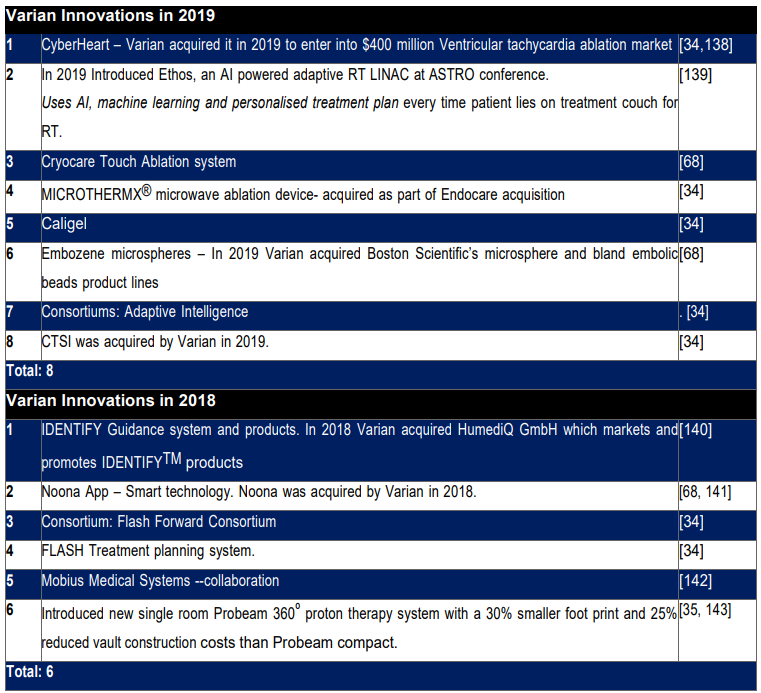
Appendix E: Siemens Healthineers Innovations
Table XXX: Siemens Healthineers Innovations in 2022, 2021, 2020, 2019 and 2018
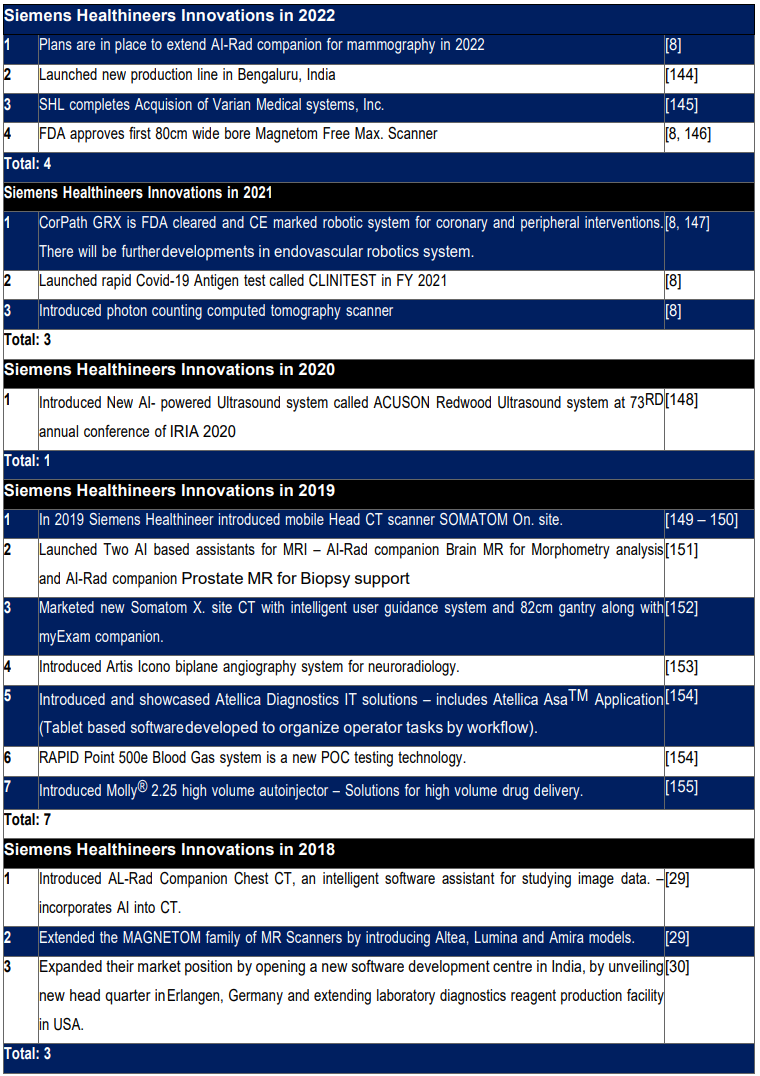
Appendix F: Accuracy Innovations
Table XXXI: Accuracy Innovations in 2022, 2021, 2020
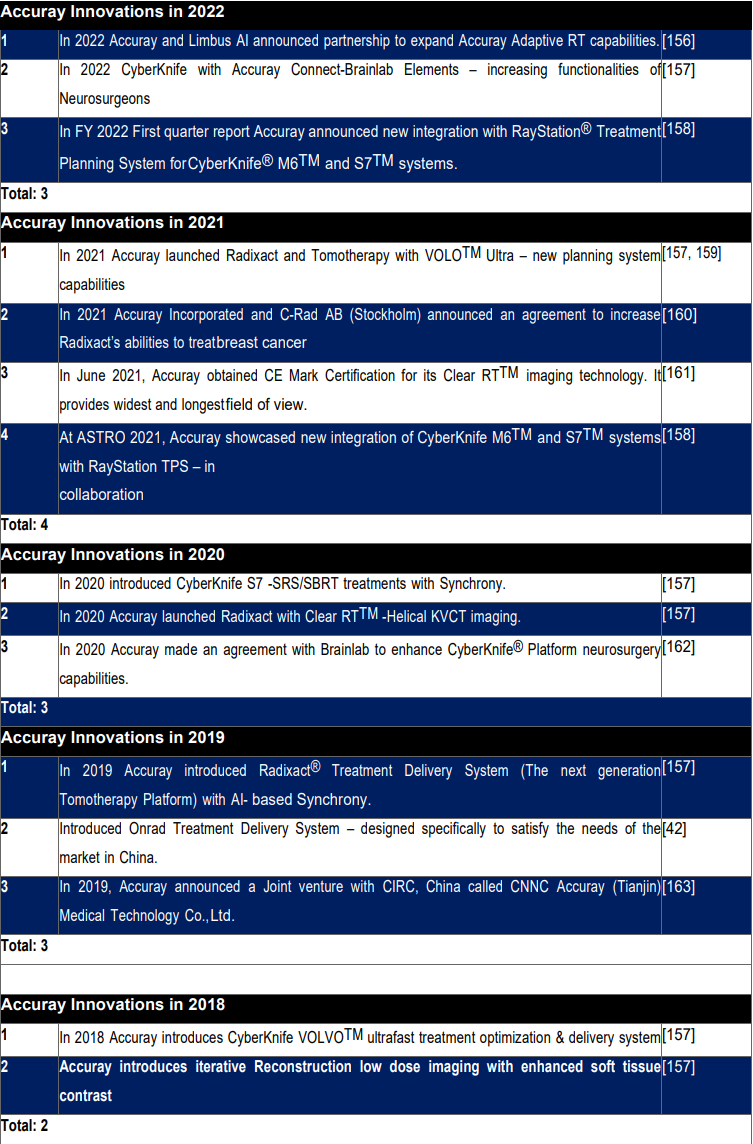
Appendix G: Scores
Table XXXII Scores: IBA & Hitachi
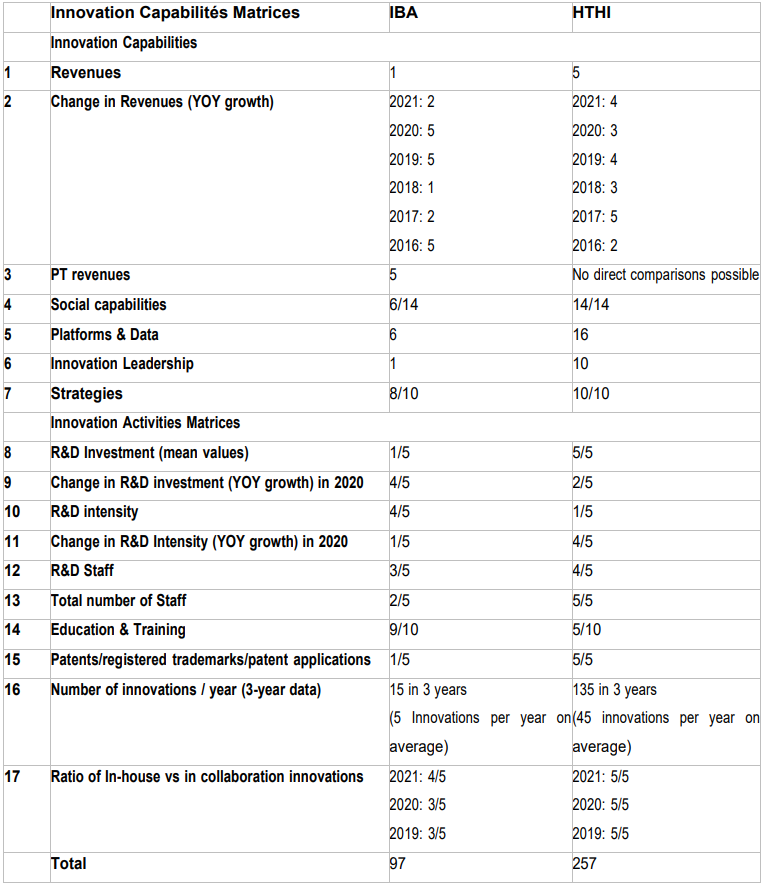
Table XXXIII: Scores: Varian, Siemens Healthineers & Accuray
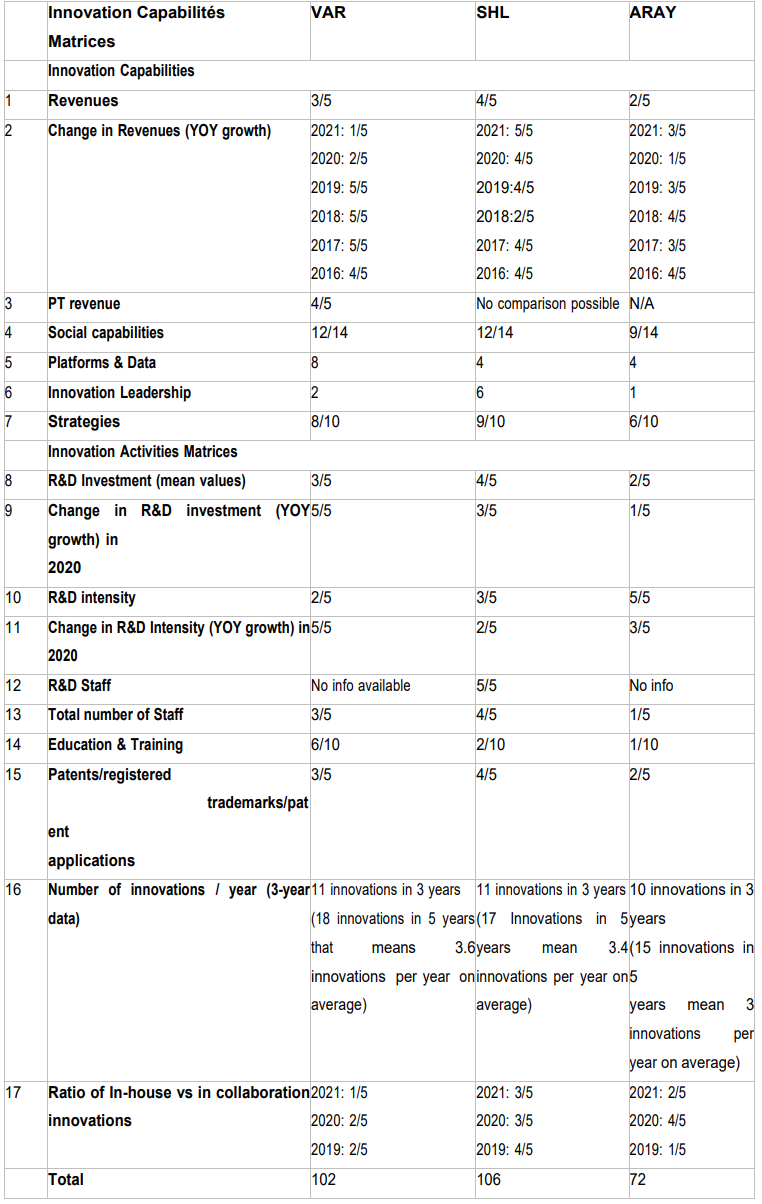
Appendix H: Abbreviations
ARAY = Accuracy
IBA = Ion Beam Applications
BDS = Beam Delivery System
EBRT = External Beam Radiation Therapy
HTHI = Hitachi
LINAC = Linear Accelerator PBS = Pencil Beam Scanning PBT = Proton Beam Therapy PT = Proton Therapy
R&D = Research & Development
RT = Radiation Therapy / Radiotherapy
SHL = Siemen Healthiness
VAR = Varian
YOY = Year over Year
Glossary
Align RT: It is a form of surface Guided Radiotherapy which is used to track a patient’s position before and during Radiotherapy.
Market Capital: It is the collective market value of a company represented in dollar amount. Its value is calculated using current market price of a company’s shares and total number of outstanding shares. It is also used to compare and classify the size of companies among analysts and investors e.g., small or large cap company.
Particle Therapy/Particle Beam Therapy: it consists of both proton beam therapy and heavy ion therapy
Proton Beam Therapy: it is a form of external beam Radiotherapy that utilizes a beam of high energy protons rather than high energy X-rays to kill cancer cells and benign tumours.
R&D Expense: is the amount of money that a company devotes to create new products or services or improve existing products or services each year. It is one of the main drivers of Innovation. It is the cost associated with product innovation.
R&D Intensity: it is used to measure R&D spending of a company divided by its sales or revenue. In other words, it is the ratio of a company’s R&D investment to its revenue. It is one of the key indicators that are used to observe resources dedicated to innovation and science as well as technology.
Year over Year Growth: it is a type of financial analysis that is used to compare the growth rate from last year to the present. It is expressed in terms of percentage. It is a key performance indicator
References
- Taqaddas, J. Anal. Oncol. 10, 32 (2021).
- Taqaddas, J. Multidiscip. Res. 2, 375 (2021)
- Taqaddas, (2021) Expert Opinions on Robotic CyberKnife Technology. J. Multidiscip. Res. 2, 285 Dec 02;2(6):285-299.
- D. Blagoev, and Z. Yordanova, Econ. Altern. 2, 5 (2015)
- J. Yap, A. De Franco, and S. Sheehy, (2021), Front Oncol. 11, 780025
- M. Vidal, C. Moignier, A. Patriarca, M. Sotiropoulos, T. Schneider, and L. De Marzi, (2021), Cancer Radiother. 25, 554
- S. Jolly, H. Owen, M. Schippers, and C. Welsch, (2020), Physica Medica. 78, 71
- Siemens Healthineers AG. Siemens Healthineers Annual Report 2021. Siemens Healthineers AG. 2021. Available at: https://www.siemens-healthineers.com/investor-relations/annual-report (Accessed 11/08/2022).
- IBA Worldwide 2022. 2022. IBA Full year 2021 Results Presentation. 2022 Mar 24. Available at: https://www.iba- worldwide.com/content/iba-full-year-2021-results-presentation (Accessed 11/08/2022).
- IBA Worldwide 2022. IBA Annual report 2021. 2022 Apr 29. Available at: https://www.iba-worldwide.com/content/iba- annual-report-2021 (Accessed 12/08/2022).
- IBA Worldwide 2022. IBA Reports Full Year 2021 Results. 2022 Mar 24. Available at: https://www.iba- worldwide.com/content/iba-reports-full-year-2021-results (Accessed 11/08/2022).
- IBA Worldwide 2022. IBA Reports Full Year 2020 Results. 2021 Mar 25. Available at: https://www.iba- worldwide.com/content/iba-reports-full-year-2020-results (Accessed 11/08/2022)
- IBA Worldwide 2022. IBA Reports Full Year 2019 Results. 2020 March 26. Available at: https://www.iba- worldwide.com/content/iba-reports-full-year-2019-results (Accessed 11/08/2022).
- BA Worldwide 2022. IBA Reports Full Year 2018 Results. 2019 Mar 21. Available at: https://www.iba- worldwide.com/content/iba-reports-full-year-2018-results (Accessed 11/08/2022).
- IBA Worldwide 2022. IBA Reports Full Year Results for 2017 Results. 2018 Mar 22. Available at: https://www.iba- worldwide.com/content/iba-reports-full-year-results-2017 (Accessed 11/08/2022).
- IBA Worldwide 2022. IBA Reports Full Year Results for 2016 Results .2017 Mar 23. Available at: https://www.iba- worldwide.com/content/iba-reports-full-year-results-2016 (Accessed 11/08/2022).
- IBA Worldwide 2022. IBA Annual report 2020 [High definition]. 2021 Apr 30. Available at: https://www.iba- worldwide.com/content/iba-annual-report-2020-high-definition (Accessed 13/08/2022).
- IBA Worldwide 2022. IBA Annual report 2019. 2020 May 06. Available at: https://www.iba-worldwide.com/content/iba- annual-report-2019 (Accessed 11/08/2022).
- IBA Worldwide 2022. IBA Annual report 2018. 2019 May 13. Available at: https://www.iba-worldwide.com/content/iba- annual-report-2018 (Accessed 13/08/2022).
- IBA Worldwide 2022. IBA Annual report 2017. 2018 Apr 25 Available at: https://www.iba-worldwide.com/content/iba- annual-report-2017 (Accessed 11/08/2022).
- IBA Worldwide 2022. IBA Annual report 2016. 2017 Apr 27. Available at: https://www.iba-worldwide.com/content/iba- annual-report-2016 (Accessed 11/08/2022).
- IBA Worldwide 2022. IBA Annual report 2015. 2016 Apr 11. Available at: https://www.iba-worldwide.com/content/annual- report-2015 (Accessed 11/08/2022).
- Hitachi, Ltd. Consolidated Financial Results for the Year Ended March 31, 2022 and Mid-term Management Plan 2024. Available at: https://www.hitachi.com/New/cnews/month/2022/04/220428.html (Accessed 12/08/2022).
- Hitachi, Ltd. Hitachi Integrated Report 2021. Available at: https://www.hitachi.com/IR-e/library/integrated/2021/index.html (Accessed 11/08/2022).
- Hitachi, Ltd. Financial Highlights (IFRS). Year ended March 31, 2021.
- Hitachi, Ltd. Hitachi Announces Consolidated Financial Results for Fiscal 2021.
- Hitachi, Ltd. Hitachi Investor Day 2021. 8. 06. 2021. Smart Life Sector. [Presentation].
- Siemens Healthineers AG. 23.11. 2020. Siemens Healthineers Annual Report 2020. Available at: https://www.siemens- healthineers.com/investor-relations/presentations-financial-publications#tab-0775783a (Accessed 11/08/2022).
- Siemens Healthineers AG. 30.09. 2019. Siemens Healthineers Annual Report 2019. Available at: https://corporate.webassets.siemens-healthineers.com/1800000006835562/383ab5036ed8/1800000006835562- 12e08501046c-Siemens-Healthineers-Annual-Report-2019.pdf (Accessed 11/08/2022).
- Siemens Healthineers AG. Siemens Healthineers Annual Report 2018. Siemens Healthineers AG, Munich. 2018. Available at: https://corporate.webassets.siemens- healthineers.com/1800000005904947/1be9e3c7fc7c/1800000005904947-ef806566e5ee-Annual-Report-2018.pdf
- Siemens Healthineers AG. Siemens Healthineers Combined Financial statements for the Fiscal years ended September 30, 2017, 2016 and 2015. Siemens Healthineers AG, Munich. 2018. Available at: https://corporate.webassets.siemens-healthineers.com/1800000004856382/af6db1da1786/1800000004856382-73e26777cfa3- Siemens_Healthineers_Combined_Financial_Statements_FY17-15_V2_.pdf (Accessed 11/08/2022)
- Siemens Healthineers AG. Siemens Healthineers Sustainability Report 2021. Siemens Healthineers AG, Munich. 2021. Available at: https://corporate.webassets.siemens-healthineers.com/e585979ac3319b35/1ba3d260915b/Siemens- Healthineers_Sustainability-Report_2021.pdf (Accessed 11/08/2022).
- Varian Medical Systems, Inc. Form 10K Annual Report. 2020. Available at: https://www.annualreports.com/Company/varian-medical-systems-inc (Accessed 11/08/2022).
- Varian Medical Systems, Inc. 2019 Annual Report. 2019
- Varian Medical Systems, Inc. 2018 Annual Report.2018.
- Varian Medical Systems, Inc. 2017 Annual Report. 2017.
- Varian Medical Systems, Inc. 2016 Annual Report. 2016.
- Varian Medical Systems, Inc. Varian Reports Results for Fourth Quarter of Fiscal Year 2020. 2020 Oct 27.
- Accuray Incorporated. Accuray Reports Fiscal 2022 First Quarter Financial Results. 2021 Nov 3.
- Accuray Incorporated. 2021 Annual Report. 2021.
- Accuray Incorporated. 2020 Annual Report. 2020. Available at: https://investors.accuray.com/static-files/a758a8c1-ff40- 43ba-87b6-7065f0d776c1 (Accessed 11/08/2022).
- Accuray Incorporated. 2019 Annual Report. 2019. Available at: https://investors.accuray.com/static-files/672d719e-7081- 43fa-9b42-5567a2fad24c (Accessed 11/08/2022).
- Accuray Incorporated. 2018 Annual Report.2018. Available at: https://investors.accuray.com/static-files/8d81ab23-939a- 464c-903c-f03e00371dba (Accessed 11/08/2022).
- Accuray Incorporated. 2017 Annual Report. 2017. Available at: https://stocklight.com/stocks/us/manufacturing/nasdaq- aray/accuray/annual-reports/nasdaq-aray-2017-10K-171052778.pdf (Accessed 13/08/2022).
- IBA Worldwide 2022. IBA Corporate Brochure 2021. 2021 May 10. Available at: https://www.iba- worldwide.com/content/iba-corporate-brochure-2021 (Accessed 11/08/2022).
- Hitachi Solutions Ltd. Microsoft Power Apps. 2022. Available at: https://www.hitachi- solutions.co.uk/technologies/microsoft-powerapps/ (Accessed 11/08/2022).
- Hitachi Energy Ltd. CIGRE Session 2022. 2022. Available at: https://www.hitachienergy.com/about-us/events-and- webinars/2022/09/cigre-session-2022 (Accessed 11/08/2022).
- Hitachi Vantara LLC. Blog. From Learning to Interning: The Voice of the Newly Hired. 2022. Available at: https://www.hitachivantara.com/en-us/news/blog.html (Accessed 11/08/2022).
- Hitachi Solutions. Blog. 2022. Available at: https://global.hitachi-solutions.com/blog/ (Accessed 11/08/2022).
- Tumblr. Hitachi Vantara. Available at: https://www.tumblr.com/tagged/Hitachi%20Vantara?sort=top (Accessed 11/08/2022)
- Flickr. Hitachi Trains. Available at: https://www.flickr.com/groups/967362@N20/ (Accessed 11/08/2022).
- Siemens Medical Solutions USA, Inc. Siemens Healthineers. Social Media Posts. 2022. Available at: https://www.siemens-healthineers.com/en-us/marketing-toolkits/mammography-breast-biopsy-toolkit/revelation-toolkit/social- posts (Accessed 11/08/2022).
- Siemens Healthcare GmbH. Connect Platforms and Smart Enablers. 2022. Available at: https://www.siemens- healthineers.com/services/customer-services/connect-platforms-and-smart-enablers (Accessed 11/08/2022).
- Siemens Healthcare GmbH. Conference and Events. 2022. Available at : https://www.siemens-healthineers.com/news- and-events/conferences-events-new (Accessed 11/08/2022).
- Siemens Healthineers. Mobile Resources. Point of Care Resources at your Fingertips. 2022. Available at: https://www.siemens-healthineers.com/at/point-of-care/mobile-resources (Accessed 11/08/2022).
- Accuray Incorporated. Media. 2022. Available at: https://www.accuray.com/who-we-are/media/ (Accessed 11/08/2022).
- Accuray Incorporated. Astro Blogs. 2022. Available at: https://www.accuray.com/category/astro/ (Accessed 11/08/2022).
- Medgadget, Inc. Plan Touch iPad App for Accuray’s CyberKnife Radiation Therapy System. 2012. Available at: https://www.medgadget.com/2012/03/plantouch-ipad-app-for-accurays-cyberknife-radiation-therapy-system.html (Accessed 11/08/2022).
- Varian Medical Systems, Inc. Blogs. 2022. Available at: https://www.varian.com/en-gb/resources-support/blogs (Accessed 12/08/2022).
- Varian Medical Systems, Inc. Varian UniteTM mobile app. 2022. Available at: https://www.varian.com/en-gb/resources- support/varian-unite-mobile-app (Accessed 12/08/2020).
- Medical EXPO. Oncology iOS application Varian Mobile. 2022. Available at: https://www.medicalexpo.com/prod/varian-oncology/product-70440-872776.html (Accessed 12/08/2020).
- Varian Medical Systems, Inc. Noona. 2022. Available at: https://www.varian.com/en-gb/products/software/care- management/noona (Accessed 12/08/2022)
- Instagram. Varian Medical Systems. Available at: https://www.instagram.com/explore/locations/1018510964/varian- medical-systems (Accessed 12/08/2022).
- Flickr. Varian Medical Systems. Everyone’s photos. Available at: https://www.google.com/search?source=univ&tbm=isch&q=Flickr.+Varian+Medical+Systems.+Everyone%E2%80%99s+pho tos&fir=E353YSWjJRZlqM%252CgAIHp9TE5fm3mM%252C_%253B9Gxgn52yBnAOMM%252CnySwYmp5Cy1PEM%252C_%253B9c0g18nZz-7SLM%252Cd0rTGBtH2LNmpM%252C_%253BjQOJhFF64d21IM%252Cd0rTGBtH2LNmpM%252C_%253BWJpEPnG4Ts Qi2M%252CnmD8mxmadyYNRM%252C_%253Bc7lkGk4gVVYN1M%252Cd0rTGBtH2LNmpM%252C_%253BC97iQZw4x CKwhM%252CBz5m5aoMx6wNeM%252C_%253BO5g3M0lejUnJvM%252Cd0rTGBtH2LNmpM%252C_%253BoBrAndO4H 1GtbM%252Cd0rTGBtH2LNmpM%252C_%253BiKwvCqY4d5F3DM%252C-5ZljO3xZuoUAM%252C_&usg=AI4_- kSWUu0oUFn9hpPD-ebHGa26UiIv0g&sa=X&ved=2ahUKEwi7g_vExZH6AhVFSkEAHV6DCYEQjJkEegQIAhAC (Accessed 12/08/2022)
- Pinterest. Halcyon [online] https://www.pinterest.co.uk/pin/529384131189397976/ (Accessed 12/08/2022).
- Tumblr. Varian Medical Systems (VAR) today announced the 360-oncology care management system [online] https://www.google.com/amp/s/jdnelsonid.tumblr.com/post/151337750783/varian-medical-systems-var-today-announced- the/amp (Accessed 12/08/2022).
- Tumblr. Radiology Education Resources. 2010. Sept 2. [online] https://healthimaginghub- blog.tumblr.com/post/1054682925/varian-medical-systems-develops-radiotherapy (Accessed 12/08/2022).
- Varian Medical Systems, Inc. Varian Sustainability Report 2019. 2019. Available at: https://www.varian.com/en-gb/about- varian/corporate-citizenship/sustainability-varian/reporting-our-progress (Accessed 12/08/2022).
- IBA Worldwide 2022. IBA launches Campus: the world’s first online proton therapy platform. 2021 Oct 10. Available at: https://www.iba-worldwide.com/content/iba-launches-campus-world-s-first-online-proton-therapy-platform (Accessed 12/08/2022).
- Varian Medical Systems, Inc. Varian MarketplaceTM. 2022. Available at: https://www.varian.com/en-gb/resources- support/varian-marketplace (Accessed 12/08/2022).
- Hitachi Vantara LLC. IoT Software and Solutions. 2022. Available at: https://www.hitachivantara.com/en-us/products/iot- software-solutions.html [Accessed 27/05/2022]
- Hitachi-High-Tech Europe GmbH. Cerebra IIoT Platform 2022. Available at: https://www.hitachi- hightech.com/eu/product_detail/?pn=ind-cerebra&version=
- Hitachi Vantara LLC. Analyst Content. Hitachi Named a Leader AGAIN in the 2021 Gartner® Magic QuadrantTM for Industrial IoT Platforms. 2022. Available at: https://www.hitachivantara.com/ext/gartner-magic-quadrant-for-industrial-iot- platform.html (Accessed 12/08/2022).
- Hitachi, Ltd. Social Innovation. AI. 2022. Available at: https://social-innovation.hitachi/en-eu/solutions/ai/ (Accessed 12/08/2022).
- Hitachi, Ltd. Hitachi Review. How Hitachi is using AI in its social Innovation Business. 2022. Available at: https://www.hitachi.com/rev/archive/2022/r2022-sp/03/index.html (Accessed 12/08/2022).
- Gov.UK Digital Marketplace. n.d. Hitachi Solutions. [online] https://www.digitalmarketplace.service.gov.uk/g- cloud/services/432336942874097
- Hitachi, Ltd. Middleware and Platform Software. Groupmax: Workflow. 2022. Available at: https://www.hitachi.com/products/it/software/prod/groupmax/plist02.html (Accessed 12/08/2022).
- Hitachi, Ltd. Middleware and Platform Software. Groupmax: Collaboration. 2022. Available at: https://www.hitachi.com/products/it/software/prod/groupmax/sol/collabo.html (Accessed 12/08/2022)
- Hitachi, Ltd. Middleware and Platform Software. Groupmax: System Management. 2022. Available at: https://www.hitachi.com/products/it/software/prod/groupmax/sol/system.html (Accessed 12/08/2022).
- Hitachi, Ltd. Smart Solutions for the Smart Business. 2022. Available at: https://www.hitachi.com.sg/ict- solutions/solutions/smart-solutions/ (Accessed 12/08/2022).
- Hitachi, Ltd. Hitachi ICT Solutions. JP1/Client Process Automation. 2022. Available at: https://www.hitachi.com.sg/ict- solutions/software/jp1/client-process-automation.html (Accessed 12/08/2022).
- Hitachi Solutions. Customer Relationship Management. CRM. 2022. Available at: https://global.hitachi- solutions.com/solutions/operations-customer-relationship-management/ (Accessed 12/08/2022).
- Hitachi, Ltd. 2019 Research & Development Strategy. To become a global innovation leader. 2019. Available at: https://www.hitachi.com/IR-e/library/presentation/190626/190626-1.pdf (Accessed 12/08/2022).
- Siemens Healthcare GmbH. Siemens Healthineers to Showcase the Power of Data in the Lab with its Atellica Diagnostics IT Solutions at AACC 2019. 2019 Aug 6. Available at: https://www.siemens-healthineers.com/press/releases/pr- 20190805031shs.html (Accessed 12/08/2022).
- Siemens Medical Solutions USA, Inc. Siemens Healthineers Guardian ProgramTM. 2022. Available at: https://www.siemens-healthineers.com/en-us/equipment-services/performance-productivity-services/guardian-program (Accessed 12/08/2022).
- RedSky Learning. Blog. Case Study. Hitachi. 2022. Available at: https://www.redskylearning.com/blog/tailored-focused- one-day-events-for-managers-in-hitachi (Accessed 10/08/2022).
- Hitachi, Ltd. Mentoring Circles. 2021 Feb 2. Available at: https://www.hitachi.eu/en-gb/about/podcasts/mentoring- circles#top (Accessed 10/08/2022).
- Hitachi, Ltd. Hitachi Sustainability Report 2021. 2021. Available at: https://www.hitachi.com/sustainability/download/pdf/en_sustainability2021.pdf (Accessed 12/08/2022).
- Siemens Healthcare Limited. Diversity & Inclusion at Siemens Healthineers. 2022. Available at: https://www.siemens- healthineers.com/en-uk/diversity-inclusion (Accessed 11/08/2022).
- Siemens Medical Solutions USA, Inc. Top Talents (TT) Program. 2022. Available at: https://www.siemens- healthineers.com/en-us/careers/top-talents (Accessed 11/08/2022).
- Varian Medical Systems, Inc. 2020 Sustainability Report. 2020. Available at: https://www.varian.com/en-gb/about- varian/corporate-citizenship/sustainability-varian/reporting-our-progress (Accessed 11/08/2022).
- Varian Medical Systems, Inc. 2018 Sustainability Report. 2018. Available at: https://varian.widen.net/s/ssbslx2bgx/sustainability_report_2018 (Accessed 11/08/2022)
- Accuray Incorporated. Accuray Corporate Citizenship. 2022. Available at: https://www.accuray.com/corporate-citizenship/ (Accessed 11/08/2022).
- IBA Group. 2020. Corporate Social Responsibility Report 2020. 2020. Available at: https://ungc-production.s3.us-west 2.amazonaws.com/attachments/cop_2021/504342/original/IBA_Group%202020_CSR%20Report.pdf?1635490381 (Accessed 13/08/2022).
- IBA Worldwide 2022. IBA Corporate Brochure 2019. 2021 May 10. Available at: https://www.iba- worldwide.com/content/iba-corporate-brochure-2019 (Accessed 12/08/2022).
- Hitachi, Ltd. 23.06.2021. The 152nd Notice of Annual General Meeting of Shareholders. 2021 Jun 23. Available at: https://www.hitachi.com/smeet-e/ (Accessed 12/08/2022).
- Siemens Healthineers AG. Corporate Governance Statement 2019. Siemens Healthineers AG. 2019. Available at: https://www.siemens-healthineers.com/investor-relations/corporate-governance (Accessed 12/08/2022).
- Imaging Technology News. Oct 23, 2018. Varian Introduces New ProBeam 3600 Proton Therapy system. 2018 Oct 23. Available at: https://www.itnonline.com/content/varian-introduces-new-probeam-360%C2%B0-proton-therapy-system (Accessed 12/08/2022).
- Varian Medical Systems, Inc. Introducing Halcyon: An Innovative Treatment Platform. 2017. Available at: https://www.varian.com/en-gb/resources-support/blogs/clinical-oncology-news/introducing-halcyon-innovative-treatment- platform (Accessed 12/08/2022).
- Varian Medical Systems, Inc. Varian Medical Systems Introduces Revolutionary New True BeamTM System for High- Precision Image Guided Radiotherapy and Radiosurgery. 2010. Available at: https://www.varian.com/about- varian/newsroom/press-releases/varian-medical-systems-introduces-revolutionary-new-truebeam
- Varian Medical Systems, Inc. Varian Unveils Innovative New Solution for Adaptive Therapy. 2019 Sep 15. Available at: https://www.varian.com/about-varian/newsroom/press-releases/varian-unveils-innovative-new-solution-adaptive-therapy (Accessed 12/08/2022).
- Accuray Incorporated. Accuray Innovation Driven Growth Strategy. 2020 Oct 26. Available at: https://investors.accuray.com/static-files/6c1a8045-5cfe-49ed-9559-ef2ccd6d3966 (Accessed 11/08/2022).
- Siemens Healthineers AG. Siemens Healthineers Sustainability Report 2019. Siemens Healthineers AG. 2019. Available at: https://www.siemens-healthineers.com/company/sustainability (Accessed 12/08/2022).
- Statista. R&D Expenditure of Hitachi, Ltd. From fiscal year 2012 to 2021. 2022. available at: https://www.statista.com/statistics/317755/research-and-development-expenditures-of-hitachi/ (Accessed 13/08/2022).
- Ion Beam Applications, SA. Meaningful Innovations [Presentation]. 2020 Oct. Available at: https://www.iba-worldwide.com/sites/protontherapy/files/media_document/ibal01_6033_ra2016_uk_v24_09052017.pdf (Accessed 10/08/2022)
- IBA Worldwide 2022. IBA launches INDux, a new training center designed to optimize customer performance and increase the uptime of their solution. 2021 Dec 20. Available at: https://www.iba-worldwide.com/content/iba-launches-indux- new-training-center-designed-optimize-customer-performance-and-increase (Accessed 10/08/2022).
- Ion Beam Applications, SA. Non-financial activities Report Year 2017. 2017. Available at : https://www.iba- worldwide.com/sites/protontherapy/files/media_document/iba_non_financial_activities_report_2017_final.pdf (Accessed 10/08/2022).
- Hitachi, Ltd. Intellectual Property Strategy. 2021 Feb 25. Available at: https://www.hitachi.com/New/cnews/month/2021/02/210225/20210225_03_ip_presentation_en.pdf (Accessed 13/08/2022).
- Hitachi Metals, Ltd. Hitachi Metals Achieves Complete Victory in Recent Decision of the U.S. Patent and Trademark Office. 2019 Jan 15. Available at: https://www.hitachi-metals.co.jp/e/pdf/pi20190115en.pdf (Accessed 13/08/2022).
- Elekta. Elekta and IBA collaborate to optimize quality assurance in radiation therapy. 2022 Mar 15. Available at: https://ir.elekta.com/investors/press-releases/2022/elekta-and-iba-collaborate-to-optimize-quality-assurance-in-radiation- therapy/
- Applied Radiation Oncology. IBA partners with Tractebel to support Proton Therapy Construction Projects. 2022 Mar 17. Available at: https://appliedradiationoncology.com/articles/iba-partners-with-tractebel-to-support-proton-therapy-construction- projects
- IBA 2022. IBA Dosimetry releases myQA® SRS technical document featuring time-saving benefit. 2022 Mar 04. Available at: https://www.iba-dosimetry.com/news-media/detail/myqa-srs-technical-document-featuring-time-saving-benefit
- IBA. IBA strengthens its Dosimetry Portfolio with Acquision of Modus Medical Devices Inc. 2022 May 03. Available at: https://www.iba-worldwide.com/sites/protontherapy/files/media_document/220503-iba-modus-acquisition-en.pdf
- IBA Worldwide 2022. IBA launches the ConformalFLASH® Alliance. 2022 Jun 30. Available at: https://www.iba- worldwide.com/content/iba-launches-conformalflash-alliance
- IBA Worldwide 2022. IBA, Fred Hutchinson Cancer Centre and the University of Washington engage in a bench-to- bedside research program for FLASH proton therapy. 2022 Aug 02. Available at: https://www.iba-worldwide.com/content/iba- fred-hutchinson-cancer-center-and-university-washington-engage-bench-bedside-research (Accessed 13/08/2022).
- IBA Worldwide 2022. IBA Dosimetry Introduces SciMoCaTM, the next generation Monte Carlo secondary dose check and Plan QA Solution. 2022 Jul 31. Available at: https://www.iba-worldwide.com/content/iba-dosimetry-introduces-scimoca- next-generation-monte-carlo-secondary-dose-check-and-plan (Accessed 13/08/2022).
- IBA RadioPharma Solutions. IBA launches versatile high-energy new Cyclotron. 2021 Jun 10. Available at: https://www.iba-radiopharmasolutions.com/iba-launches-versatile-high-energy-new-cyclotron (Accessed 13/08/2022).
- IBA. myQA® Phoneix. High- resolution digital detector array. 2022. Available at: https://www.iba- dosimetry.com/product/myqa-phoenix (Accessed 13/08/2022).
- IBA Worldwide 2022. IBA Reports Half Year 2021 Results. 2021 Aug 25. Available at: https://www.iba- worldwide.com/content/iba-reports-half-year-2021-results (Accessed 13/08/2022).
- GlobeNewswire. IBA and TRAD Tests & Radiations announce collaboration to develop next generation radiation processing application. 2021 Oct 28. Available at: https://www.globenewswire.com/news- release/2021/10/28/2322301/0/en/IBA-and-TRAD-Tests-Radiations-announce-collaboration-to-develop-next-generation- radiation-processing-application.html (Accessed 13/08/2022).
- IBA. IBA and SCK CEN join forces to enable production of Actinium-225. 2021. Sep 15. Available at: https://ml- eu.globenewswire.com/Resource/Download/e0746c28-9517-4343-b32f-e46ebd56d268 (Accessed 13/08/2022).
- RaySearch Laboratories. RaySearch and IBA expand their partnership in proton therapy. 2021 Oct 26. Available at: https://www.raysearchlabs.com/media/press-releases/2021/raysearch-and-iba-expand-their-partnership-in-proton-therapy/ (Accessed 13/08/2022).
- IBA Worldwide 2022. IBA and NorthStar Medical radioisotopes Expand Collaboration to Enable Global Availability of Diagnostic Radioisotope Technnetium-99m [Tc-99m]. 2021 Mar 08. Available at: https://www.iba-worldwide.com/content/iba- and-northstar-medical-radioisotopes-expand-collaboration-enable-global-availability (Accessed 13/08/2022).
- IBA Worldwide 2022. IBA subsidiary, Normandy Hadrontherapy, launches development of carbon therapy system in Normandy, France. 2019 Sep 20. Available at: https://www.iba-worldwide.com/content/iba-subsidiary-normandy- hadrontherapy-launches-development-carbon-therapy-system-normandy (Accessed 13/08/2022).
- IBA Dosimetry GmbH. IBA Dosimetry launches myQA® iON – a unique environment for fast and accurate cancer patient QA in proton therapy. 2019 Jun 06. Available at: https://www.iba-worldwide.com/sites/protontherapy/files/media_document/iba-dosimetry_press-release_2019-06-06_myqa-ion_patient- qa_for_pt.pdf (Accessed 13/08/2022)
- IBA. IBA announces high level production results achieved by its cyclotron at UZ Brussels. 2018 Jun 18. Available at: https://www.iba-radiopharmasolutions.com/sites/default/files/2020-09/IBA%20PR%20UZ%20results%20SNMMI18.pdf (Accessed 13/08/2022).
- Helmholtz-Zentrum Dresden Rossendorf. Institute of Radiooncology. High Contrast imaging for Cancer Therapy with Protons. 2018. Nov 29.
- IBA Worldwide 2022. IBA and the Beaumont Hospital’s Cancer institute in Royal Oak, Michigan announce the first irradiation of a Spot Scanning Proton Arc Therapy Plan [SPArc]. 2018 Oct 18. Available at: https://www.iba- worldwide.com/content/iba-and-beaumont-hospital-s-cancer-institute-royal-oak-michigan-announce-first-irradiation
- IBA Worldwide 2022. IBA Dosimetry launches SMARTSCANTM Automated and Guided Beam Commissioning Solution at AAPM 2018. 2018 Jul 26. Available at: https://www.iba-worldwide.com/content/iba-dosimetry-launches-smartscan- automated-and-guided-beam-commissioning-solution-aapm-2018 (Accessed 13/08/2022).
- IBA Worldwide 2022. IBA receives marketing authorization for Proteus® ONE in Brazil. 2018 Sep 19. Available at: https://www.iba-worldwide.com/content/pt/iba-receives-marketing-authorization-proteus-one-brazil (Accessed 13/08/2022).
- IBA Worldwide 2022. IBA and RaySearch showcase the first Online Adaptive Proton Therapy workflow at ESTRO. 2018 Apr 16. 2018 Apr 16. Available at: https://www.iba-worldwide.com/content/iba-and-raysearch-showcase-first-online-adaptive- proton-therapy-workflow-estro (Accessed 13/08/2022).
- IBA Worldwide 2022. IBA Dosimetry to Showcase DOLPHIN Advancements Enabling Verification of the complete RT Treatment Chain. 2018 Apr 19. Available at: https://www.iba-worldwide.com/content/iba-dosimetry-showcase-dolphin- advancements-enabling-verification-complete-rt-treatment (Accessed 13/08/2022).
- Hitachi, Ltd. News Releases. Available at: https://www.hitachi.com/New/cnews/index.html (Accessed 16/08/2022).
- Varian Medical Systems, Inc. CryoCare Touch. 2022. Available at: https://www.varian.com/en- gb/products/interventional-solutions/cryocare-touch (Accessed 09/08/2022)
- Cision US Inc. Varian and Cincinnati Children’s /UC Health Proton Therapy Centre Complete Enrolment of FAST-01, First Human Clinical Trial of FLASH Therapy for Cancer. 2021 Oct 25. Available at: https://www.prnewswire.com/news- releases/varian-and-the-cincinnati-childrensuc-health-proton-therapy-center-complete-enrollment-of-fast-01-first-human- clinical-trial-of-flash-therapy-for-cancer-301407072.html (Accessed 09/08/2022)
- Varian Medical Systems, Inc. 26 May 2021. Varian receives FDA “Breakthrough Device Designation” for its Cardiac Radioablation (CRA) System for Treatment of Refractory Ventricular Tachycardia (VT). 2021 May 26. Available at: https://www.varian.com/about-varian/newsroom/press-releases/varian-receives-fda-breakthrough-device-designation-its (Accessed 09/08/2022)
- Varian Medical Systems, Inc. Varian Acquires CyberHeart. 2019 May 09. Available at: https://www.varian.com/en- gb/node/6527 (Accessed 14/08/2022).
- Varian Medical Systems, Inc. Ethos Adaptive Radiotherapy: Redefining Cancer Treatment. 2021 Aug 16. Available at: https://www.varian.com/en-gb/resources-support/blogs/clinical-oncology-news/ethos-adaptive-radiotherapy-redefining- cancer (Accessed 14/08/2022)
- Varian Medical Systems, Inc. Varian announces Acquision of humediQ Global GmbH. 2018 Aug 06. Available at: https://www.varian.com/about-varian/newsroom/press-releases/varian-announces-acquisition-humediq-global- gmbh#:~:text=PALO%20ALTO%2C%20Calif.%2C%20Aug,management%20system%20for%20radiation%20therapy (Accessed 14/08/2022)
- Varian Medical Systems, Inc. Varian expands cancer care portfolio with Noona Healthcare Acquision. 2018 Oct 12. Available at: https://www.varian.com/en-gb/node/6608 (Accessed 14/08/2022).
- Varian Medical Systems, Inc. Varian acquires Mobius Medical System. 2018 Feb 05. Available at: https://www.varian.com/en-gb/node/6681 (Accessed 14/08/2022).
- Varian Medical Systems, Inc. Varian introduces New ProBeam 3600 Proton Therapy System. 2019 Feb 27. Available at: https://www.varian.com/en-gb/node/4262 (Accessed 13/08/2022).
- Siemens Healthcare Private Limited. Siemens Healthineers Expands its manufacturing footprint in India with a new production line of Computed Tomography scanners approved under the Government of India’s PLI scheme. 2022 Apr 04. Available at: https://www.siemens-healthineers.com/en-in/press-room/press-releases/pr-20220404-hc (Accessed 14/08/2022).
- Varian Medical Systems, Inc. Siemens Healthineers completes acquisition of Varian, strengthening its position as a holistic partner in healthcare. 2021 Apr 15. Available at: https://www.varian.com/en-gb/about-varian/newsroom/press- releases/siemens-healthineers-completes-acquisition- varian#:~:text=Siemens%20Healthineers%20AG%20(Frankfurt%3A%20SHL,announced%20on%20August%202%2C%202 020. (Accessed 14/08/2022).
- Medical Device Network. FDA approves Siemens’ MAGNETOM Free.Max MR Scanner. 2021 Jul 07. Available at: https://www.medicaldevice-network.com/news/fda-approves-siemens-magnetom/ (Accessed 14/08/2022).
- Corindus, Inc. CorPath GRX. 2022. Available at: https://www.corindus.com/ (Accessed 21/08/2022)
- Siemens Healthcare Private Limited. Siemens Healthineers India launches ACUSON Redwood Ultrasound System at IRIA 2020. 2020 Jan 24. Available at: https://www.siemens-healthineers.com/en-in/press-room/press-releases/pr- 20200124001hc.html (Accessed 14/08/2022).
- Siemens Healthcare Diagnosticos. S.A. SOMATOM On.site. 2022. Available at: https://www.siemens- healthineers.com/br/computed-tomography/mobile-head-ct/somatom-on-site (Accessed 14/08/2022).
- Siemens Healthcare GmbH. Siemens Healthineers bring CT scanner to the patient bedside. 2019 Dec 02. Available at: https://www.siemens-healthineers.com/press/releases/pr-onsite.html (Accessed 14/08/2022).
- Siemens Healthcare GmbH. Siemens Healthineers introduces Al-based assistants for magnetic resonance imaging. 2019 Dec 02. Available at: https://www.siemens-healthineers.com/press/releases/pr-ai-rad-companions-mri.html (Accessed 14/08/2022).
- Siemens Healthcare GmbH. Siemens Healthineers introduces Al-based assistants for magnetic resonance imaging. 2019 Dec 02. Available at: https://www.siemens-healthineers.com/press/releases/pr-ai-rad-companions-mri.html (Accessed 14/08/2022).
- Siemens Healthcare GmbH. Siemens Healthineers markets new Somatom X. cite CT scanner with revolutionary user guidance system. 2019 Nov 22. Available at: https://www.siemens-healthineers.com/press/releases/pr-somatom-xcite.html (Accessed 14/08/2022).
- Siemens Healthcare GmbH. Artis Icono from Siemens Healthineers sets new standards in neuroradiology. 2019 Mar 01. Available at: https://www.siemens-healthineers.com/press/releases/pr-20190228007shs.html (Accessed 14/08/2022).
- Siemens Healthcare GmbH. Siemens Healthineers to showcase the power of Data in the Lab with its Atellica Diagnostics IT Solutions at AACC 2019. 2019 Aug 06. Available at: https://www.siemens-healthineers.com/press/releases/pr- 20190805031shs.html (Accessed 14/08/2022).
- Pharmaceutical Technology. SHL to showcase Solutions for High-Volume Drug Delivery AT Pharmapack Europe. 2019 Jan 14. Available at: https://www.pharmaceutical-technology.com/contractors/drug-delivery/shl-group/pressreleases/shl-to- showcase-solutions-for-high-volume-drug-delivery-at-pharmapack-europe/ (Accessed 14/08/2022)
- Accuray Incorporated. Accuray and Limbus Al-driven Technology to enhance Accuray Adaptive Radiotherapy Solutions.2022 Jun 02. Available at: https://investors.accuray.com/news-releases/news-release-details/accuray-and-limbus- ai-inc-partner-leverage-limbus-innovative-ai (Accessed 21/08/2022)
- Accuray Incorporated. Our Innovation Roadmap. 2022. Available at: https://www.accuray.com/innovation/ (Accessed 13/08/2022).
- Accuray Incorporated. Accuray Reports Fiscal 2022 First Quarter Financial Results. 2021 Nov 03. Available at: https://investors.accuray.com/news-releases/news-release-details/accuray-reports-fiscal-2022-first-quarter-financial-results (Accessed 06/08/2022).
- Accuray Incorporated. Accuray unveils VOLOTM Ultra, the latest innovation for the Radixact® System, at ASTRO 2021. 2021 Oct 19. Available at: ttps://investors.accuray.com/news-releases/news-release-details/accuray-unveils-volotm-ultra- latest-innovation-radixactr-system
- Accuray Incorporated. C-Rad and Accuray sign agreement to enhance Radixact® System Breast Cancer Treatment Capabilities. 2021 Oct 04. Available at: https://investors.accuray.com/news-releases/news-release-details/c-rad-and-accuray- sign-agreement-enhance-radixactr-system-breast (Accessed 13/08/2022).
- Accuray Incorporated. Accuray receives 510 (K) FDA Clearance for ClearRTTM Helical KVCT Imaging for the Radixact® Treatment Delivery System. 2021 Jan 05. Available at: https://investors.accuray.com/news-releases/news-release- details/accuray-receives-510k-fda-clearance-clearrttm-helical-kvct (Accessed 14/08/2022).
- Brainlab AG. Accuray announces agreement with Brainlab to Expand CyberKnife® Platform treatment Capabilities for the Neuro-Radiosurgery Market. 2020 Oct 28. Available at: https://www.brainlab.com/press-releases/accuray-expand- cyberknife-platform-treatment-capabilities/ (Accessed 13/08/2022).
- Accuray Incorporated. FAQ. Accuray Joint Venture to manufacture and sell Radiation oncology Systems in China. Available at: https://investors.accuray.com/static-files/f52e5a39-a8c0-415d-ba91-ce1a8537c59a (Accessed 13/08/2022).
- Grand View Research, Inc. Radiation Oncology market Size, Industry Report, 2021-2028. 2022. Available at: https://www.grandviewresearch.com/industry-analysis/radiation-oncology-market (Accessed 16/08/2022).
- YCharts. Ion Beam Applications SA (IOBCF). 2022. Available at: https://ycharts.com/companies/IOBCF/market_cap (Accessed 24/08/2022).
- CompaniesMarketCap.com. Hitachi. Market capitalization of Hitachi 2022. (6501.T). Available at: https://companiesmarketcap.com/hitachi/marketcap/ (Accessed 24/08/2022).
- CompaniesMarketCap.com. Varian. Market capitalization of Varian Medical systems (VAR). 2022. Available at: https://companiesmarketcap.com/varian-medical-systems/marketcap/ (Accessed 24/08/2022)
- CompaniesMarketCap.com. Siemens Healthineers. Market capitalization of Siemens Healthineers (SHL.DE). 2022. Available at: https://companiesmarketcap.com/siemens-healthineers/marketcap/ (Accessed 21/08/2022)
- CompaniesMarketCap.com. Accuray. Market capitalization of Accuray (ARAY). 2022. Available at: https://companiesmarketcap.com/accuray/marketcap/ (Accessed 24/08/2022)
- YCharts. Ion Beam Applications SA (IOBCF). Ion Beam Applications Free Cash Flow. 2022. Available at: https://ycharts.com/companies/IOBCF/free_cash_flow_ttm (Accessed 24/08/2022)
- Hitachi, Ltd. Outline of Consolidated Financial Results for the Year Ended March 31, 2022. Fiscal 2021. 2022 Apr 28. Available at: https://www.hitachi.com/New/cnews/month/2022/04/220428/2021_Anpre.pdf (Accessed 24/08/2022)
- Yahoo Finance. Varian Medical Systems, Inc. 2022. Available at: https://nz.finance.yahoo.com/quote/VNM.DE/cash- flow?guccounter=1&guce_referrer=aHR0cHM6Ly93d3cuZ29vZ2xlLmNvbS8&guce_referrer_sig=AQAAAG9jXPOHepx0AT3 Gq4yLqmzEfG_NE2cncD2cPyxTgmTLXsIWMmGODaoBhu_uicv- HMnUNYrSsrgey7HhQRNtID6aO6nMr5Py57ImD5X9u0usxoDnIdbJt2eDpDxoqSVUdD85BFcbSSn6HAkMSqlwvWHqXXSvc OkPkBHcsaM-BIrb (Accessed 24/08/2022)
- YCharts. Accuray Inc (ARAY). Accuray Free Cash Flow. 2022. Available at:https://ycharts.com/companies/ARAY/free_cash_flow_ttm (Accessed 24/08/2022).
Quick links
- Abstract
- Introduction
- Literature Review
- Conclusion
- Materials and Methods
- Results and Discussion
- Social capabilities
- Platform and Data
- Innovation leadership
- Training and Educational Improvements
- Registered Trademarks and Patents
- 2. Radiation Oncology Market Overview
- 3. Financial Market Analysis
- 1. Recommendations
- Limitations of the study
- Conclusion
- Declarations
- Supplementary Data
- Glossary
- References

