
Research Article | DOI: https://doi.org/10.58489/2836-2276/015
1Brazilian Institute of Rehabilitation, Department of Medical Nutrition, Av. das Américas, 2603 - Barra da Tijuca, Rio de Janeiro - RJ, 22631-002, Brasil
2Faculty of Pharmacy, The Chair of Pharmaceutical Biology, University of Ljubljana, Askerceva 7, 1000 Ljubljana, Slovenia
*Corresponding Author: Rade Injac
Citation: Ludvick da Silva Rego, Caio Bisaggio da Silva, Rade Injac. (2023). Investigation of Protein Food Waste and Related Costs in Nutrition Unit Within Private Brazilian School. Journal of Food and Nutrition. 2 (2); DOI: 10.58489/2836-2276/015
Copyright: © 2023 Rade Injac, this is an open-access article distributed under the Creative Commons Attribution License, which permits unrestricted use, distribution, and reproduction in any medium, provided the original work is properly cited.
Received: 02 August 2023 | Accepted: 15 August 2023 | Published: 17 August 2023
Keywords: Proteins, Food, Nutrition Unit, Buffet, Waste
Rest-intake is the amount of food that returns in the plates of the diners. The daily recording and evaluation of the quantity is important to define strategies to reduce waste, increase productivity and sustainability of the food and nutrition unit (FNU). Study carried out at a private school in the city of Rio de Janeiro, 500 lunches are served daily for students/employees, always with two protein options. Data collection took place for 20 days, in August and September/ 2019 and only the amounts of the rest of the protein intake were considered. For comparison and improvement confirmation, data from previous period was used when buffet was unlimited for all food including proteins. In the total of 1,565 kg of food served there was a rest of 58.64 kg, which is equivalent to 451 meals monthly. On average, the FNU had a percentage of waste close to 14% during unlimited buffet, which was improve to a waste level at 3.75%. The new waste outcome of the FNU is within what the literature data considers optimal, with remark that data collected are only for protein. It would be necessary to analyze all the rest-intake to determine with accuracy, but the wasted amount of protein, the most expensive input of preparations, indicates that the waste is higher than the ideal. From unlimited to limited buffet option, huge improvement in protein waste management was shown (ca. 10%), however, with some additional modifications including amount of chicken per portion as well as presents of chicken and beef as most liked proteins, would potentially further improve, and reduce protein waste.
The Food and Nutrition Units (FNUs) are spaces where activities aimed at preparing meals are carried out, with the aim of producing food within hygienic standards, seeking diner satisfaction, quality, and productivity [1]. In Brazil, 39 million tons of food are discarded daily, which is equivalent to twelve billion reais (ca. 3 million USD) a year [2]. Food waste in a FNU can be evaluated through three methods: diners’ leftovers (plate), dirty buffet leftovers (buffet), and clean leftovers (kitchen) [3]. The rest-intake is the amount of food that returns on the diners' trays and plates. Some factors may affect the increase in this rate, such as the size of the plate and the utensils used for distribution; these can cause an excessive amount of food to be served, increasing waste and consequently costs [4].
The daily registration and evaluation of the amount of waste and leftovers is important to define strategies aimed to reducing waste, increasing the productivity and sustainability of a FNU [5]. This control required evaluating the efficiency of the FNU, where the nutritionist has a fundamental role in the planning and cost control [6]. In food and nutrition units, waste causes high financial losses, especially with proteins. A study carried out at the FNU of a University Restaurant determined a waste of 804.4 kg of food in ten days, with the cost of the rest-intake of lunch totaling an average of R$ 572.59 daily (ca. 150 USD) [7].
We learned that school kitchen had open buffet policy. Every student had right to take food as much as possible on one time service. With that approach protein waste on the monthly base was close to 14% which is by international classification very poor food and waste management [8]. Considering that the rest-intake, mainly of protein, can cause financial losses for the FNUs of any institutions, this study was carried out to check if controlled service conditions would improve waste management and reduced costs. Main objective of this study is to identify the impact of the loss of animal protein, in a Food Unit and Nutrition at a private school in the west zone of the city of Rio de Janeiro with the new limited food access regime. Finally, old and new system will be compared with numerical findings as well as further recommendations for improvement and better management of most expensive part of the meal, in this case animal proteins.
The present study was carried out in a Food and Nutrition Unit (FNU) of a private school in the west zone of the city of Rio de Janeiro.
In this FNU, breakfast, lunch and afternoon snack are provided for diners. For the purposes of this study, only the amounts of the rest of the protein intake from lunch were considered, since it is the meal that concentrates the most significant part of proteins, object of the study. Approximately 500 meals are served from 11:00 am to 2:30 pm. Data collection was carried out on 20 consecutive business days, in August and September 2019 (Figure 1). For comparison with old system of unlimited one time served buffet, 20 consecutive business days data were used from April 2019.
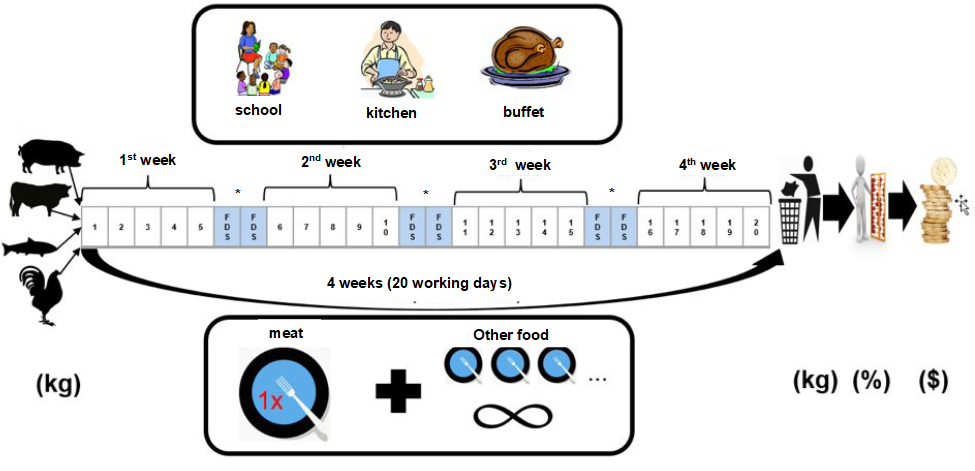
Fig 1: Study protocol.
*FDS – free days
The menu is different every day, always having two protein options for diners to choose from. Two servings of protein are offered per person, totaling an average of 130 g and must be served the first time the diner passes through the buffet. The other preparations can be served more times, without restriction, although all foods are served by maids.
Dirty leftovers (protein left over from the buffet) and clean leftovers (protein left over from the kitchen) were not included in this study. The rest ingested was measured by the evaluator at the FNU right after the diners left their plates at the pass-through using a Ramuza DCR CL30 model scale with a capacity of 30 kg.
The number of menus, as well as type of proteins and food amount was the same in both service approaches, unlimited and limited, with relative standard deviation for each of the parameters below 5 percentage. The values are presented as absolute in kg and calculated to related costs in Brazilian currency (R$) and American dollar (USD). For this study average exchange rate from that period was used (1 USD = 4 R$). Comparative values for unlimited and limited food service have been expressed as absolute value for total waste and mean ± standard deviation (SD) for calculations per day. ANOVA, followed by an LSD post hoc test (SPSS 15.0 for Windows), was used to compare the different services, and the values of p less then 0.05 were considered as statistically significant (a: p less then 0.05; b: p less then0.01; c: p less then 0.001).
During the 20 days of study, 40 preparations were offered, Figure 2. illustrates the percentage of times each animal protein was used. It is observed that the amount of chicken was the highest (50 percentage), as it is a low-cost option and with great acceptance by diners. In second place is red meat with 20 percentage, which has a higher cost than chicken. Fish, pork and eggs are in third place, because they are proteins that normally are not so well accepted, they represent, separately, 10
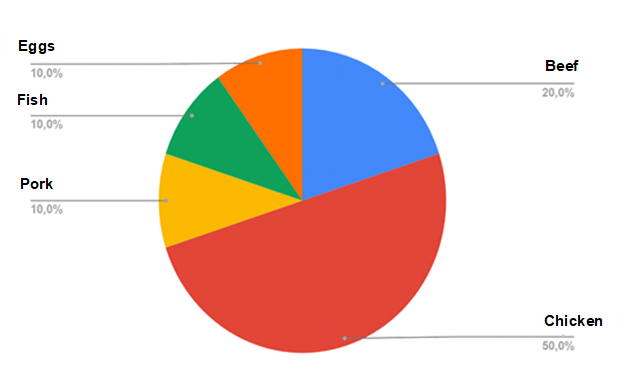
Fig 2: Percentage distribution of protein preparations.
As indicated in Table 1, among the proteins served, the most frequent was chicken with 20 repetitions. Next was beef (8 times), while the other proteins had the same frequency, 4 times.
Table 1: Daily preparation plans.
| Day | Preparation/Option 1 | Preparation/Option 2 |
| 1 | Oven-baked chicken | Omelet |
| 2 | Roasted drumstick | Liver baits |
| 3 | Roasted pork loin | Chicken fillet in sauce |
| 4 | Chicken fricassee | Scrambled eggs |
| 5 | Fish baits in cornmeal | Roasted thigh fillet |
| 6 | Beef fillet in sauce | Chicken fillet with peppers |
| 7 | Roasted omelet | Chicken drumstick with potatoes |
| 8 | Rump beef steak with garlic | Roasted chicken drumstick |
| 9 | Baked fish fillet | Baked chicken thigh fillet |
| 10 | Liver with onions | Grilled chicken fillet |
| 11 | Grilled tenderloin | Grilled chicken |
| 12 | Grilled tilapia fillet | Boneless drumstick |
| 13 | Liver strips | Grilled chicken fillet |
| 14 | Roasted pork loin | Chicken strips |
| 15 | Chicken | Omelet with Sauce |
| 16 | Meatballs with sauce | Grilled chicken |
| 17 | Boneless pork fillet | Chicken drumstick |
| 18 | Roasted rump beef fillet | Roasted chicken thigh fillet |
| 19 | Breaded tilapia fillet | Cheesy chicken |
| 20 | Ground beef | Grilled chicken breast |
According to Benetti [8] a percentage of leftovers lessen 5percentage is considered excellent, between 5 percentage and 10 percentage good, between 10 percentage and 15percentage fair and grater then 15percentage poor. During the 20 days of collection there was a total rest of 58.64 kg in 1,565 kg of food served, therefore, on average, the FNU has a percentage of waste with rest ingested of 3.75percentage, considered optimal (Table 2).
It is important to emphasize that this study measured only the rest of the protein intake and did not account for the other foods that were discarded. If all foods were counted, the percentage of loss could be higher, negatively affecting the FNU classification.
Chicken, beef, fish, pork and eggs total 858 kg, 319 kg 186 kg, 146 kg and 56 kg respectively. Chicken was served every day as one of the options, the rest found was higher than the other protein option on 14 out of the 20 days, therefore diners tend to prefer the other preparations, probably due to the high frequency with which chicken is served.
On the days when the chicken had a lower percentage of ingested rest, the preparations were: omelet on day 1, fish baits in cornmeal on day 5, oven omelet on day 7, grilled tenderloin on day 11 and rump fillet with onions on day 18.
On two of the four days that the omelet was served, it had a higher intake than the chicken. Therefore, the rejection of preparations with eggs is 50%, showing that they were not well accepted by diners.
The total rest intake (58.64 kg) that was discarded of protein, which is equivalent to 451 meals, since the amount served for each diner is 130 g. This waste is equivalent to almost a day's worth of meals, considering that an average of 500 meals are served daily.
Vaz [9] defined an adequate intake rest range, between 15 g and 45 g per capita. The average daily waste found in the present study was 5.86 g per capita, a value greater than almost a third of the minimum established in the author's range of adequacy. As the present study measured only the amount of protein, probably, in the FNU analyzed, waste could exceed the ideal values suggested by Vaz [9] and other studies.
Table 2: Amount of food leftovers served during period of 20 working days (a month) and its related costs.
| Day | Preparations | Total food (kg) | Wast food (kg) | Wast food (%) | Waste cost (R$) | *Waste cost (USD) |
| 1 | Chicken/Egg | 56/10 | 1.60/0.80 | 2.86/8.08 | 21.17/4.00 | ~6.0 |
| 2 | Chicken/Beef | 56/30 | 3.15/0.55 | 5.62/1.83 | 28.22/5.21 | ~8.0 |
| 3 | Chicken/Pork | 56/35 | 3.20/0.65 | 5.71/1.86 | 37.42/9.98 | ~12.0 |
| 4 | Chicken/Egg | 36/13 | 2.20/0.30 | 6.11/2.27 | 23.67/1.50 | ~6.0 |
| 5 | Chicken/Fish | 36/40 | 0.70/0.88 | 1.94/2.20 | 7.82/33.00 | ~10.0 |
| 6 | Chicken/Beef | 36/38 | 1.95/2.68 | 5.42/7.05 | 26.15/58.35 | ~21.0 |
| 7 | Chicken/Egg | 86/18 | 1.38/1.10 | 1.60/6.07 | 12.25/5.50 | ~5.0 |
| 8 | Chicken/Beef | 56/56 | 2.70/1.55 | 4.82/2.77 | 24.01/43.24 | ~17.0 |
| 9 | Chicken/Fish | 36/60 | 2.30/0.90 | 6.39/1.50 | 25.69/21.52 | ~12.0 |
| 10 | Chicken/Beef | 41/30 | 2.75/0.60 | 6.71/2.00 | 36.81/5.69 | ~11.0 |
| 11 | Chicken/Pork | 36/50 | 1.10/1.55 | 3.06/4.31 | 14.75/23.75 | ~10.0 |
| 12 | Chicken/Fish | 36/50 | 1.45/0.85 | 4.03/1.70 | 9.28/14.02 | ~6.0 |
| 13 | Chicken/Beef | 36/25 | 2.05/1.25 | 5.70/5.00 | 18.41/8.30 | ~7.0 |
| 14 | Chicken/Pork | 30/36 | 1.60/1.20 | 4.44/4.00 | 14.37/13.08 | ~7.0 |
| 15 | Chicken/Egg | 36/15 | 0.45/0.95 | 1.25/0.53 | 4.04/4.75 | ~2.0 |
| 16 | Chicken/Beef | 36/50 | 1.85/1.80 | 5.14/3.60 | 16.61/29.39 | ~12.0 |
| 17 | Chicken/Pork | 36/25 | 2.15/0.80 | 5.97/3.20 | 6.04/13.76 | ~5.0 |
| 18 | Chicken/Beef | 36/50 | 1.00/1.95 | 2.78/3.90 | 8.07/33.13 | ~10.0 |
| 19 | Chicken/Fish | 45/36 | 1.80/0.60 | 5.00/1.33 | 16.16/9.90 | ~12.0 |
| 20 | Chicken/Beef | 36/40 | 1.20/1.10 | 3.33/2.75 | 10.78/17.96 | ~8.0 |
| Sum | All | 1565 | 58.64 | 3.75 | 717.77 | ~180.0 |
| Avg | Per day | 78.25 | 2.93 | 3.75 | 35.88 | ~9.0 |
*at the time of investigation 1 USD was approximately 4 R$
Data obtained by Amorim [10] show a percentage of leftover intake of 12.68 percentage and volume of 80.85 g per capita, while Moura et. al [11] obtained a value of 10.41percentage and 60.39 g per capita. It is worth mentioning that in the cited studies, the remaining intake of all foods served was considered and not only proteins.
Of the proteins used, the highest cost of the remaining intake is directly linked to chicken (R$ 361.72, ca. 90 USD). This cost does not refer to the price of the raw material, but the high amount of rest-intake due to the frequency of preparations with this type of protein. Another case of high financial waste is linked to preparations with beef, due to the high cost of the raw material and not the amount of leftovers ingested (Table 3). According to statistical evaluation, only beef has waste level like the total average waste. While for pork, fish and eggs, limited buffet we can see very significant difference in comparison with total average with positive trend of lower waste. On the other hand, chicken waste is above total average and significantly different to all other groups if calculated kg per day (meal). This is clear signal that some modification still must be done for the chicken preparation.
Table 3: Cost of the waste per source of the protein. Numbers are showing statistically significant differences amongst investigated groups using total (T) as control group (a: p less then 0.05; b: p less then 0.01; c: p less then 0.001).
Number of meals | Waste total (kg) | Waste per day (kg) ± SD | Costs (R$) | *Costs (USD) | |
| Chicken (C) | 20 | 36.58 | 1.83±0.25Ta,Ec,Fc,Pb,Ba | 361.72 | 91.0 |
| Beef (B) | 8 | 11.48 | 1.43±0.13Ec,Fc,Pa | 195.27 | 49.0 |
| Pork (P) | 4 | 4.20 | 1.05±0.09Tb,Ea | 60.57 | 15.0 |
| Fish (F) | 4 | 3.23 | 0.79±0.08Tc | 78.44 | 20.0 |
| Egg (E) | 4 | 3.15 | 0.78±0.06Tc | 15.75 | 4.0 |
| Total (T) | 40 | 58.64 | 1.47±0.15 | 717.77 | ~180.0 |
*at the time of investigation 1 USD was approximately 4 R$
Finally in the Table 4 is shown comparison between unlimited and limited buffet options related to proteins. In all cases limited buffet is significantly better than unlimited. All groups have the most significant improvement (p less then 0.001) with new approach of service, while chicken is not yet there (p less then 0.01). This is once again confirming previous statement related to everyday availability of chicken and the amount of the portion.
Table 4: Amount of the waste per source of the protein for unlimited and limited buffet service. Numbers are showing statistically significant differences amongst investigated groups using unlimited (U) buffet as control group (a: p less then 0.05; b: p less then 0.01; c: p less then 0.001).
Number of meals | Waste Unlimited Buffet (kg) | Waste Limited Buffet (kg) | Waste Unlimited (U) Buffet per day (kg±SD) | Waste Limited Buffet per day (kg±SD) | |
| Chicken | 20 | 71.08 | 36.58 | 3.55±0.47 | 1.83±0.25Ub |
| Beef | 8 | 62.31 | 11.48 | 7.78±0.97 | 1.43±0.13Uc |
| Pork | 4 | 27.39 | 4.20 | 6.84±0.89 | 1.05±0.09Uc |
| Fish | 4 | 33.41 | 3.23 | 8.35±0.77 | 0.79±0.08Uc |
| Egg | 4 | 23.91 | 3.15 | 5.97±0.61 | 0.78±0.06Uc |
| Total | 40 | 218.1 | 58.64 | 5.45±0.58 | 1.47±0.15Uc |
Definitely new approach (limited buffet) can be explored further with some portion modification of beef (smaller size to reduce costs) and chicken (smaller size to reduce waster amount), as well as increasing or balancing beef chicken and beef availability. Instead of having chicken every day, once per week could be beef main protein source combined with pork or fish or eggs.
Challenges are not only in Brazilian school canteens but rather globally with different options to explore including already proposed changes. No matter of nations, religion, school size, country size, or other demographic parameters, we can find everywhere around the globe same challenge [12-17]. With less and less found availability and more population, food management and waste management will become one of the key topics for survival and proper mental and physical development of children.
The FNU in question is within what the literature considers optimal, but the collected data are only about the protein. A study of everything else ingested would be necessary to accurately assess the situation in which it finds itself, but the wasted amount of protein, which is the most expensive input in preparations, is already an indication that waste is greater than ideal.
A strategy to reduce the rest ingested would be to allow diners to divide the two portions of protein in their passages through the buffet, allowing the customer to serve themself twice, thus avoiding putting an excessive amount on the plate.
Rethinking portion sizes would also be positive, as children and adults receive the same amount of protein. Younger students are probably not able to consume everything they get on their plates, resulting in protein waste that could be avoided.
Combining these strategies with amount, type and combinations of proteins, a satisfaction survey on weekly preparations, and a nutritional education program would possibly reduce the remaining protein intake and consequently improve the financial performance of the FNU.
The authors have not declared any conflicts of interest.
We would like to thank Teresa Cristina Miglioli for support in collaboration with local school and some advice for the final investigation.