Archive : Article / Volume 2, Issue 1
- Research Article | DOI:
- https://doi.org/10.58489/2836-2276/013
Moisture Sorption Characteristics of Wheat-Mango Flake
1Department of Food Science and Technology, University of Agriculture, Makurdi, Nigeria
2Department of Food Science and Technology, Kaduna Polytechnic, Kaduna, Nigeria
Momoh Clement Owoicho
Momoh Clement Owoicho (2023). Moisture Sorption Characteristics of Wheat-Mango Flake 2(1). DOI: 10.58489/2836-2276/013
© 2023 Momoh Clement Owoicho, this is an open-access article distributed under the Creative Commons Attribution License, which permits unrestricted use, distribution, and reproduction in any medium, provided the original work is properly cited
- Received Date: 24-05-2023
- Accepted Date: 02-06-2023
- Published Date: 04-08-2023
Moisture Sorption Isotherms, flakes, wheat, mango
Abstract
In this study, the moisture sorption characteristics of wheat-mango flakes in relation to their shelf-life in high-density polyethylene material were studied. A preliminary research work was done to ascertain the optimum acceptable levels of Mango pulp addition to wheat flake production using 0 to 80 % (w/v) of wheat and mango pulp. Sensory evaluation was done and the most accepted flake samples were selected, the main research, the level of mango pulp was the varied ratio of 0 to 50 giving rise to a total of 5 samples. Moisture sorption characteristics of the flakes were studied using standard methods. The goodness of fit of the various models was evaluated using the percentage root mean square of the errors (%RMS) for adsorption and desorption. In the adsorption mode, the RMS ranged from 14.36 to 43.62 (GAB), 13.82 to 67.69(BET), 2.69 to 12.97(OSWIN), 4.10 to 16.35 (HENDERSON) in W: M 100:0 sample. For W:M 90:10, the RMS ranged from 38.12 to 43.76 (GAB) 34.04 to 95.33 (BET), 3.24 to 4.48 (OSWIN), 1.89 to 13.85 (HENDERSON). For W: M 80:20, the RMS ranged from 29.48 to 90.85 (GAB), 18.10 to 68.72 (BET), 1.91 to 4.75 (OSWIN), 4.40 to 15.46 (HENDERSON). For W: M 70:30, the RMS ranged from 35.22 to 47.91 (GAB), 14.51 to 40.56 (BET), 2.81 to 4.20 (OSWIN), 2.32 to 13.78 (HENDERSON). For W:M 60:40, the RMS ranged from 23.59 to 55.91 (GAB), 14.41 to 42.96 (BET), 2.96 to 5.97 (OSWIN), 1.95 to 15.28 (HENDERSON). And for W:M 50:50, the values ranged from 41.20 to 55.10 (GAB),13.85 to 60.53 (BET), 1.78 to 5.65 (OSWIN), 1.25 to 14.35 (HENDERSON) respectively. Wheat-mango flakes sorption isotherm obeys type II curve and Oswin and Henderson model fits better and shelf-life for wheat-mango flake is greater than 12 months in high density polyethylene packaging film used as packaging material. Sensory evaluation revealed that acceptable flakes can be produced from wheat supplemented with mango fruit pulp. Blend formulation wheat: mango at 50:50 was mostly acceptable
Introduction
Wheat flakes are delicious and nutritious whole-grain hot cereals that are easy to prepare. Flakes are made from the highest quality steamed, dried, and flattened whole-grain wheat. Wheat flakes have a mild, nutty flavor and it is a good source of dietary fiber (Enenche, 2020). The flakes also add desirable texture to baked goods. Wheat flakes are similar to corn flakes, but wheat flakes are made of whole wheat and wheat bran. Whole wheat is rolled and made into flakes which help retain its fiber content along with other vital nutrients. Wheat flakes are healthy and popular breakfast cereal originally manufactured by Kellogg’s through the treatment of whole wheat grains. Wheat flakes are also fortified with other nutrients like iron, calcium, Fiber, etc. Wheat bran is commonly added to enhance the nutritional value of wheat flakes. These flakes provide the value of all parts of the grain and only suffer a slight nutritional loss from heating. They may be eaten after soaking or cooking in milk or vegetable broth. They form part of the famous muesli breakfast food (Okafor and Usman, 2012).
Wheat flakes are cold breakfast cereals that are rich in nutrients, such as vitamins and minerals, but low in calories. Wheat bran flakes are distinct from other breakfast cereals because there are relatively low in sugar and rich in fiber which can be beneficial for health. Additionally, the nutritional profile of wheat flakes may encourage weight loss, similarly, other grains that are used to produce flakes are rye, oats, spelled, and kamut (Obiakor, 2008).
Apart from satisfying the taste buds of consumers, it is a good source of vitamins, minerals, fiber, protein, and carbohydrates. Flakes are good sources of folate beneficial for the formation of new cells, and help in preventing birth defects, colon cancer, and heart diseases (Stanley and Cauvian, 2003). Thiamine is good for carbohydrate metabolism, energy production, and cognitive functions. Wheat flakes are also rich in fiber which helps to reduce cholesterol, constipation, and the risks of colon cancers. The very low saturated fats content gives a good satiety. Wheat flakes have no cholesterol. Low cholesterol reduces the risk of heart attacks and heart diseases (Stanley and Cauvian, 2003). The flakes have very high iron which is a main component of hemoglobin. A high iron diet is needed to maintain healthy blood levels which helps keep the brain alert (FAO, 2010). When wheat flakes are consumed with milk, they provide a high protein-rich food. Protein is essential to the structure of red blood cells for the proper functioning of antibodies, resisting infections, and the regulation of enzymes and hormones for the growth and repair of body tissues (Stanley and Cauvian, 2003). However, whole wheat products have low contents of vitamin C, carotenoids, and essential minerals. Because of these limitations, wheat products require fortification and complementation for balanced diets.
Mango fruits contain amino acids, carbohydrates, fatty acids, minerals, organic acids, protein, vitamins and ascorbic acid (vitamin C). Ripe mangoes contain moderate levels of vitamin C, other essential vitamins and minerals but are fairly rich in pro-vitamin A (Stanley and Cauvian, 2003),
Moisture sorption isotherms are useful thermodynamic tools for determining interactions of water and food substances, and provide information to assess food processing operations such as drying, mixing, packaging, and storage. Knowledge of sorption isotherms is also important for predicting stability and quality changes during packaging and storage of dried foods (Hossain
et al
., 2001). Sorption isotherms can also be used to investigate structural features of a product such as specific surface area, crystallinity, pore volume and pore size distribution. Such data can be used for selecting appropriate storage conditions, and packaging systems that optimize retention of aroma, color, texture, nutrients and biological stability (Ariahu
et al
., 2006). Information on moisture sorption characteristic of flakes from mango pulp and wheat is limited hence this study seeks to produce wheat-mango flakes and evaluate the moisture sorption characteristics with the purpose of increasing utilization of the raw materials and minimizing wastes
Materials and Methods
Procurement of Material
Wheat grains and firmly Ripe mango fruits (Mangifera indica) (Julie and Peter varieties) were purchased from Makurdi Modern market, Benue state. Nigeria.
Equipment used
Oven, weighing balance, rolling pins, trays, drum dryer, milling machine, blender, knives, spatula, packaging material, Conical flakes, beaker, measuring Cylinder, distillation apparatus, soxhlet apparatus, desiccator, crucibles, Digestion flask
Reagents used for analysis
Concentrated Tetraoxosulphate IV, Toluene, distilled water, diethyl ether, Sodium hydroxide solution, Sodium Sulphate, and Copper Sulphate.
Sample Preparation
Sample Preparation
Preparation of wheat flour
Essentially, the grains were sorted and washed with tap water followed by draining. The clean grains were then pre-cooked, boiled in a water bath maintained at 92 0C for 10 min and then drained for 20 min followed by drying in an electric oven (Uniscope sm N9053 laboratory) at 70 0C for 1 hour. After allowing to cool, grains were milled using a milling machine and sieved to pass through a 0.5 mm mash according to the method as described by Enenche, (2020).
Preparation of mango pulp
Firmly ripe Mango fruit (Mangifera indica) was prepared using the traditional method of pre-cleaning including sorting, hand-picking and washing which helps to remove sand and any foreign matter that can contaminate the fruit. The fruits were peeled, and the mesocarp milled into pulp; as shown in Figure 1. The blend formulation is shown on Table 1. The production of flakes was done following the method as described by Enenche (2020) with some modifications as shown in Figure 2
Table 1: Formulation of Blends
Wheat Flour (%) | Mango Pulp (%) |
100 | 0 |
90 | 10 |
80 | 20 |
70 | 30 |
60 | 40 |
50 | 50 |
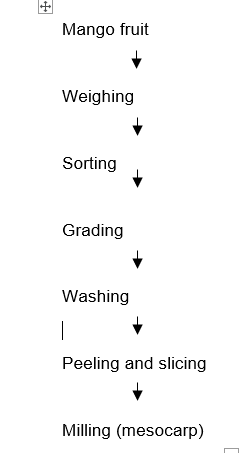
Figure 1: Production of Mango Pulp Source: Modified Bakhm, (2018).
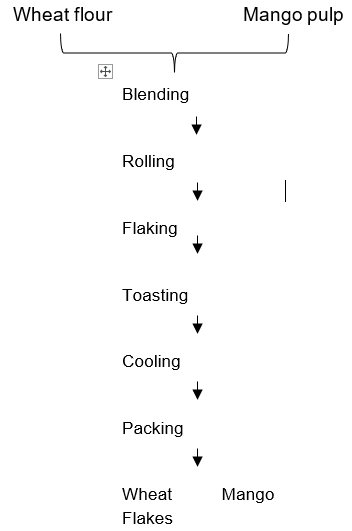
Figure 2: Production of Wheat-mango flakes.Source: Modified Enenche, (2020)
Methods of Analyses
Moisture sorption studies:
Equilibrium moisture content versus water activity measurement
Equilibrium moisture content was determined gravimetrically by exposing the samples to atmosphere of known relative humidities following the method described by Ariahu et al., (2006) with some modification. Six concentrations of Sulphuric acid, 10, 20, 30, 40, 50, and 60% were used to provide water activities ranging from 0.15 to 0.96 as described by Ruegg (1980). A thermostatically controlled biochemical incubator (LRB-70F, England) and 500ml plastic container were used for temperature and humidity controls respectively. The solutions made from the acid (100ml each) were carefully introduced into the plastic container. A screen made of wire gauze was forced into the plastic containers to form support for the samples.
For desorption studies, the dried product was rewet by sprinkling with distilled deionized water followed by mixing with the spatula. The rewet samples were allowed to equilibrate overnight in a refrigerator before use. Duplicate samples (0.5g each) of dried and rewet flakes were weighed in crown corks and placed on a wire gauze above the solution for adsorption and desorption. The containers were covered tightly and placed in the incubator at selected temperatures of 10, 20, 30, and 40oC. Small glass bottles containing toluene were placed in the plastic containers to prevent mold growth at relative humidities above 50% (Mclaughlin and Magee, 1998). The samples were removed and weighed every 2days using electronic balance (FAO 2004) until differences between consecutive readings were <0>
Moisture sorption data analysis:
The equilibrium moisture data were fitted using GAB, BET, HENDERSON, and OSWIN models. These models were used due to their reported simplicity, versatility and suitability for starchy foods and vegetable (Ariahu et al., 2006)
The monolayer moisture contents were calculated using the GAB, and BET models. The monolayer moisture values for the BET model were used to evaluate the apparent area of sorption of the sorbent using the following equation (Ariahu et al., 2006).
So= (1/Ms) No AMo (m2/g solid)
Where no= Avogadro’s number (6.023x10²³ molecules/mole)
A=apparent surface area of one water molecules (1.05x10⁻¹⁹m2)
Ms=relative molecular mass of water =18.
Mo = monolayer moisture content (gH20/g solids)
So =apparent area of sorption.
The net isoteric heat of sorption was calculated by applying Clausius-Clapeyron equation to the isoters obtained at constant moisture contents up to 20gH20/100 g solid following the procedures reported by Ariahu et al., (2006) by plotting ln (aw) verse 1/T for a specific moisture content, ∆Hst was calculated from the slope (-∆Hst/R). The differential entropy of sorption (∆So) was obtained from the intercept co-efficient (∆So/R) of the plot of ln (aw) versus 1/T for a specific moisture content.
Sensory evaluation:
Sensory evaluation of the product was carried out by 20 untrained panelists (students of University of Agriculture, Makurdi, Benue State). Samples were coded using set of random digit numbers and portable water was provided for rinsing of mouth between after sample testing. The panel evaluated each product for appearance, taste, texture, aroma and overall acceptability on a 5-point scoring scale (1=very poor, 2= poor, 3=fair, 4=good, and 5=very good) as described by Ihekeronye and Ngoddy, (1985)
Statistical Analysis
All analyses were performed in triplicate and data collected were subjected to ANOVA using SPSS software.
The derivatives and constants of the Henderson and Oswin models were obtained by least square linear regression from their respective equations, GAB and BET equation were analyzed by non-linear regression using H2O Analyzer series 97 software. The goodness of fit of different models were evaluated with percentage root mean square of error (%RMS) between experimental (Mobs) and predicted (Mest) moisture content as described by Wang and Brennan (1991)
Where Mobs and Mest are experimented and predicted moisture values respectively and n is number of experimental data
Results and Discussions
Moisture sorption characteristics
Adsorption and desorption
The isotherms were sigmoid in shape corresponding to type II isotherms. It could be observed that for both adsorption and desorption, the equilibrium moisture content increased with increased in H2O activity at constant temperature and decreased as the temperature increased. The moisture desorption isotherms were higher than the adsorption isotherms at comparable temperature and H2O activity (aw) values. This is a manifestation of hysteresis in the water sorption behavior of the wheat-mango flakes. The surface area of sorption (So) of wheat mango flakes were higher than values of 100 to 250m2/g solid exhibited by most foods as reported by Labuza (2000). The higher values obtained by wheat mango flakes could be that H2O molecules are able to plasticize the various long chain polymers that makes up the structural matrix, thus exposing more sites for sorption.
Evaluation of sorption isotherm models
The GAB Isotherm parameters and derivatives
The GAB constants (C and K) varied with temperature for both adsorption and desorption isotherms. The variation of C-values with temperature was greater than those of K-value. The C and K values for adsorption and desorption isotherms did not show a definite pattern across the temperature. The C-values for adsorption isotherm ranged from 58.0 to119.0 and 116.7to 138.3 for desorption at temperature 10 oC, 79.3 to 117.5 for adsorption and 71.7 to 145.5 for desorption at 20 oC, 93.4 to 149.8 for adsorption and 60.6 to 144.1 for desorption at 30 oC and 70.6 to 224.9 for adsorption and 59.9 to 113.9 for desorption at 40 oC . This result is in conformity with that reported by Ariahu et al., (2006)
The K-values for adsorption isotherm ranged from 0.543 to 0.655 and 0.539 to 0.571 for desorption at temperature 10 oC, 0.549 to 0.577 for adsorption and 0.511 to 0.612 for desorption at 20 oC, 0.503 to 0.578 for adsorption and 0.499 to 0.643 for desorption at 30 oC and 0.413 to 0.609 for adsorption and 0.548 to 0.612 for desorption at 40 oC .
The GAB monolayer (Mo) moisture contents for adsorption ranged from 11.4 to 18.5 (gH2O/100g solid) and 0.539 to 0.571(gH2O/100 g solid) for desorption at temperature 10 oC, 12.7 to 18.5 (gH2O/100 g solid) for adsorption and12.2 to 18.3 (gH2O/100g solid) for desorption at 20oC, 13.9 to 19.3 (g H2O/100g solid) for adsorption and 11.9 to 15.2 (gH2O/100g solid) for desorption at 30 oC and 8.4 to 13.9 (gH2O/100 g solid) for adsorption and 15.5 to 10.7 (gH2O/100g solid) for desorption at 40 oC respectively, this values and trends are in consonant with that reported by Labuza, (2000) and Ariahu et al., (2006). The GAB equation is an improved version of BET model and is based on theoretically sound principles (Agurre et al., 1989), in literature. The GAB isotherm was used to fit sorption isotherms up to H20 activities of 0.9 in many cases (Rizvi, 1995). The use of GAB parameters has physical significance and it is considered to be the best equation available for representing monolayer isotherms for many food materials (Wolf et al., 1985, Aguirre et al., 1989). The GAB model provided monolayer moisture content values and other useful information to the heat of sorption and monolayer and multilayer of wheat mango flakes. Also, this model fits well in describing the sorption isotherm for wheat mango flakes.
The BET isotherm parameters and derivatives
The monolayer (Mo) moisture content and the surface area (So) for monolayer moisture (Adsorption and Desorption) decreased with increase in temperature. the monolayer moisture content for adsorption ranged from 8.547 to 11.765(gH2O/100 g solid) and 10.309 to 12.988(gH2O/100 g solid) for desorption at temperature 10 oC, 7.875 to 10.101 (gH2O/100 g solid) for adsorption and 8.265 to 12.195 (gH2O/100 g solid) for desorption at 20 oC, 7.936 to 12.195 (gH2O/100 g solid) for adsorption and 8.065 to 10.417 (gH2O/100 g solid) for desorption at 30 oC and 8.000 to 11.365 (gH2O/100 g solid) for adsorption and 8.408 to 9.709 (gH2O/100 g solid) for desorption at 40 oC respectively.
The surface area (So) values for adsorption ranged from 300.293 to 413.344 (m2/g solid) and 362.208 to 456.288 (m2/g solid) for desorption at temperature 10 oC, 260.254 to 354.891(m2/g solid) for adsorption and 428.465 to 403.841 (m2/g solid) for desorption at 20 oC, 428.465 to 316.524 (m2/g solid) for adsorption and 365.981 to 270.263 (m2/g solid) for desorption at 30 oC and 399.252 to 281.074 (m2/g solid) for adsorption and 341.109 to 254.595 (m2/g solid) for desorption at 40 oC respectively.
The BET model is known to fit experimental sorption data in the range of H20 activities up to 0.5(Agurre et al, 1989). In spite of this limitation, the BET model provides values of monolayer moisture content, which is an important parameter in food deterioration studies. According to Agurre et al, (1989) the main limitation of BET theory appears to be the assumption that all absorbed molecules in layers other than the 1st have liquid like evaporation-condensation properties, the BET model provided good values for monolayer moisture content of wheat mango flakes but did not fit properly for the product.
Henderson parameters and derivatives
The regression coefficient (r2) did not show any definite trend for both adsorption and desorption. The regression coefficient of absorption ranged from 0.983-0.991 and 0.990-0.983 for desorption at temperature 10 oC, 0.946 to 0.997 for adsorption and 0.992 to 0.946 for desorption at 20 oC, 0.974 to 0.982 for adsorption and 0.993 to 0.956 for desorption at 30 oCand 0.978 to 0.808 for adsorption and 0.974 to 0.939 for desorption at 40 oC.
The Oswin parameters and Derivatives
The correlation coefficient (r2) of absorption ranged from 0.991 to 0.983 and 0.990 to 0.984 for desorption at temperature 10 oC, 0.996 to 0.983 for adsorption and 0.986 to 0.992 for desorption at 20 oC, 0.986 to 0.975 for adsorption and 0.993 to 0.976 for desorption at 30 oC and 0.995 to 0.763 for adsorption and 0.996 to 0.990 for desorption at 40oC. The Oswin model usually has a high coefficient of regression and has the advantage of simplicity of use in describing moisture sorption isotherms. It was found to be a good fit for sorption in various food products (Lomauro et al., 2000, Mok and Hettiarachy, 2012), especially for nonproteinous materials and best for starchy foods.
Goodness of fit of sorption models
The goodness of fit of the various models was evaluated using the percentage root mean square of the errors (%RMS). In the adsorption mode, the RMS ranged from 14.36 to 43.62 (GAB), 13.82 to 67.69(BET), 2.69 to 12.97(OSWIN), 4.10 to 16.35(HENDERSON) for W:M 100:0, For W:M 90:10, the RMS ranged from 38.12 to 43.76 (GAB), 34.04 to 95.33(BET), 3.24 to 4.48 (OSWIN), 1.89 to 13.85 (HENDERSON). For W:M 80:20, the RMS ranged from 29.48 to 90.85 (GAB), 18.10 to 68.72(BET), 1.91 to 4.75 (OSWIN), 4.40 to 15.46 (HENDERSON). For W:M 70:30, the RMS ranged from 35.22 to 47.91 (GAB), 14.51 to 40.56(BET), 2.81 to 4.20 (OSWIN), 2.32 to 13.78 (HENDERSON). For W:M 60:40, the RMS ranged from 23.59 to 55.91 (GAB), 14.41 to 42.96 (BET), 2.96 to 5.97 (OSWIN), 1.95 to 15.28 (HENDERSON). And for W:M 50:50, the values ranged from 41.20 to 55.10 (GAB),13.85 to 60.53 (BET), 1.78 to 5.65 (OSWIN), 1.25 to 14.35 (HENDERSON) respectively.
It can be seen that the RMS (%) of fit of the various models varied from 37.65 to 79.84 (GAB), 13.82 to 41.98 (BET), 3.57 to 7.81 (OSWIN), 2.78 to 16.08 (HENDERSON) for W:M 100:0, For W:M 90:10, the RMS ranged from 38.12 to 51.89 (GAB), 50.90 to 72.33 (BET), 2.77 to 4.14 (OSWIN), 5.01 to 14.17 (HENDERSON). For W:M 80:20, the RMS ranged from 35.17 to 56.48 (GAB), 62.55 to 84.23 (BET), 2.18 to 4.63 (OSWIN), 2.49 to 14.38 (HENDERSON). For W:M 70:30, the RMS ranged from 28.21 to 50.24 (GAB), 25.13 to 80.54 (BET), 2.52 to 7.22 (OSWIN), 5.14 to 13.84 (HENDERSON). For W:M 60:40, the RMS ranged from 33.41 to 60.69 (GAB), 53.51 to 99.5 (BET), 4.01 to 6.20 (OSWIN), 5.01 to 15.02 (HENDERSON). And for W:M 50:50, the values ranged from 56.76 to 53.61 (GAB), 34.39 to 61.04 (BET), 2.99 to 5.75 (OSWIN), 5.74 to 14.02 (HENDERSON) respectively. The goodness of fit of the models examined was assessed using the percent root mean square of error (%RMS). The lower the value, the better the fit. According to Wang and Brennan (1991), %RMS ≤ 10 indicates a reasonable fit for practical purposes. The Henderson’s model with overall mean %RMS≤ 10 best described the moisture sorption isotherm of wheat mango flakes followed by Oswin. The GAB and BET plot fitted poorly to the entire isotherm of wheat mango flake. The Henderson model has the additional advantage of incorporating temperature, thereby making the model more versatile for describing the EMC of wheat mango flakes.
Estimation of packaging requirements
For the estimation of packaging requirements for the storage of wheat mango flakes, the characteristics of the packaging film were evaluated. The permeability of the packaging films was estimated at 58 and 82 RH at 30 oC. The vapor pressure of pure water (Pc) at 30 oC (31.877 mmHg) was adapted. The permeability of the packaging film was determined. The result is in accordance with that reported by Carson (1999).
Estimated shelf life of wheat-mango flakes in high-density polyethylene material.
For the storage of 250 g of wheat mango flakes with the initial moisture content of 5.05gH20/100 g solids at storage RH of 58 and 82 % at 30 oC with a critical moisture content of 9.12gH20/100 g solids and equilibrium moisture content of 11.89 gH20/100 g solids (at 58%RH) and 14.80gH20/100 g solids (at 80%RH). The results of the shelf-life estimate showed RH to be the function of shelf life since shelf life decreased with an increased in RH. The shelf life ranged from 13.6 months to 21.2 months at 58 % RH and 11.2 months to 19.4 months at 82 % RH, higher humidity tends to generate higher mass transfer rates at constant temperature. The low shelf life obtained at higher relative Humidity (82% RH) implies that the wheat mango flake is hygroscopic and requires effective packaging in moisture-proof packaging material for a longer shelf life. These results conform to earlier studies by Diosady et al., (1996). At ambient temperature (30±2oC) of storage, the shelf life decreased with increase in the storage Humidity. This is consistent with earlier observation that the EMC of wheat mango flakes increased as the H2O activity increased at constant temperature.
Sensory evaluation
There was no significant difference in terms of general acceptability between samples 80:20, 70:30, 60:40 and 50:50. Sample 100:0, 90:10W: M was significantly different from all the samples at 5 % significant level and sample 50:50W:M had the highest mean value for general acceptability, hence was generally accepted.
Conclusion
Wheat mango flakes sorption isotherm obeys type II curve and Oswin and Henderson model fits better and Shelf life for wheat-mango flake is greater than 12months in high density polyethylene packaging film used as packaging material. Sensory evaluation revealed that acceptable flakes can be produced from wheat supplemented with mango fruit pulp. Blend formulation wheat: mango at 50:50 was mostly acceptable.
Acknowledgment
The author acknowledges the UNESCO International Center for Biotechnology Nsukka, for scholarship and provision of funds for this research.
References
- Agurre, L.W. (1989) Fruits and Vegetable production in Africa, Hafner publication company, South Africa. Pp 58-59.
- Ariahu, C. C., Kaze, S. A., & Achem, C. D. (2006). Moisture sorption characteristics of tropical fresh water crayfish (Procambarus clarkii). Journal of Food Engineering, 75(3), 355-363
- Bakhm, C. O. (2018). Production of flakes from blends of African yam bean (Sphenostylis stenocarpa) and cassava flour. American journal of food and nutrition 2(3):65-68,
- Talla, A. (2012). Experimental determination and modelling of the sorption isotherms of kilishi. British journal of applied science & technology, 2(4), 379-389.
- Caurie, M. (2005). The unimolecular character of the classical Brunauer, Emmett and Teller adsorption equation and moisture adsorption. International journal of food science & technology, 40(3), 283-293.
- Diosady, L.L., Rizvi, S.S.H., Cai W. and Tegdoeu, D.J. (1999). Moisture sorption of canola meals and application to packaging Journal of Food Science, 61 (1): 204-208.
- Enenche, G. I. (2020). Food analysis and instrumentation theory and practices. Naphthali prints. A division of HG support Nig. Ltd. #6 Adeniyi Jones close surulere, Lagos, Nigeria. ISBN: 1234765
- Tveterås, S., Asche, F., Bellemare, M. F., Smith, M. D., Guttormsen, A. G., Lem, A., ... & Vannuccini, S. (2012). Fish is food-the FAO’s fish price index. PloS one, 7(5), e36731.
- Gal, S. (1983). The need for, and practical applications of sorption data. Physical properties of foods.
- Hossam, M., Sharma, S.A and Caralli, M. (2001). Sensory evaluation as a tool in determining the acceptability of innovative products developed by undergraduate students in food science and technology at the University of Trinidad and Tobago. Journal of curriculum and teaching, 3(1): 1927-2685.
- Ihekoronye, A. I., & Ngoddy, P. O. (1985). Integrated food science and technology for the tropics. Macmillan.
- Labuza, T.P. (2000). Moisture sorption: practical aspects of isotherm measurement and use.St Paul MN: reviewed in 2000, American Association of cereals chemists, pp 5-48.
- Lamauro, G. L. Kellogg, P and Lolb, B. (2000). Food packaging: principles and practice. Taylor and Francis, New York.
- McLaughlin, C, P. and Magee, T. R. A. (1998). The determination of sorption and the isosteric heat of sorption for potatoes, Journal of Food Engineering, 35:267-280
- Mok, C. and Hetiarachy, N.S. (1990). Moisture sorption characteristics of ground sunflower nut meat and its products. Journal of Food Science. 55:786-789.
- Oswin, C. R. (1946). The kinetics of package life III. The isotherm. Journal of chemistry and industry (London), 65:419-423.
- Okafor, P. H, and Usman, E. (2012). Adsorption of gases in multi-molecular layers, Rock press, pp 122-pp129
- Obiakor, M. (2008). Calculations of the activity of water in Sulfuric acids solutions at various temperatures. Lebeusimmitted-wiss and technologies, 13:22-24.
- Rizvi, S.S.S. (1995). Moisture adsorption properties and adsorption isosteric heat of dehydrated slices of pastirme (Turkish dry meat product). Meat Science, 71:678-576.Rockland, C. B. and Nishi, S. K (1980). Influence of water activity on food product quality and stability. Food Technology, 34(34): 42-51.
- Alakali, J., Irtwange, S. V., & Satimehin, A. (2009). Moisture adsorption characteristics of ginger slices. Food Science and Technology, 29, 155-164.
- Toledo, R.T. (2010). Fundamentals of food process engineering, 2nd Edition, Westport Connecticut, the A V Publishing company, pp 1-50.
- Wang, N., & Brennan, J. G. (1991). Moisture sorption isotherm characteristics of potatoes at four temperatures. Journal of Food Engineering, 14(4), 269-287.
- Wolf, K., Peter J, and Hotchkiss, F. (1985). Plant Evolution and the Origin of crops species 2nd Edition, CABI publishing limited Michigan, USA Pp 25-30