
Research article | DOI: https://doi.org/10.58489/2836-3590/001
Department of Biochemistry, Faculty of Health Sciences, Karatekin University, 18200 Cankiri, Turkey.
*Corresponding Author: Emrah Caylak
Citation: Emrah Caylak, (2022). Quality and Health Risk Assessment in Drinking Water of Cankiri, Turkey. Pollution and Effectson Community Health.1(1). DOI: 10.58489/2836-3590/001
Copyright: © 2022 Emrah Caylak, this is an open access article distributed under the Creative Commons Attribution License, which permits unrestricted use, distribution, and reproduction in any medium, provided.
Received: 04 July 2022 | Accepted: 15 July 2022 | Published: 16 August 2022
Keywords: Drinking water, heavy metal, polycyclic aromatic hydrocarbon, trihalomethane, water quality, health.
The aim of this study is to identify the quality and potential health or carcinogenic risks of raw and purified water of Cankiri/Turkey. Firstly, the water parameters were compared with the permissible limits. As, Hg and Ni levels were found to be above the Turkish and WHO permissible limits. Then, using physicochemical parameters, the water quality index (WQI) rating determined that the quality of the water was good. When heavy metals were used to calculate the WQI value, the water quality was determined to be low or very low quality due to the high levels of heavy metals in the samples. The oral and dermal hazard coefficient (HQ) and hazard index (HI) of heavy metals were evaluated for health risk assessment. HQing and HI indices of As and Hg were higher than one. It is also carcinogenic risk assessments indicated that As, B[ghi]P, total PAHs and THMs were also found >10−5. These assessments have revealed the potential risks to humans and can be used by managers to determine the necessary drinking water treatment strategy to ensure the safety of consumers.
Clean drinking water is essential for health and is used for domestic purposes as drinking, food preparation and personal hygiene. Access to safe and high-quality drinking water is a fundamental human right, and the provision of clean and high-quality water must be ensured by state authorities. Water quality is affected by the geology and mineralogy of watersheds (natural), as well as the contamination of ground and surface waters by humans, or errors in the treatment and distribution of water (anthropogenic) (WHO 2011).
Drinking water is polluted mainly by heavy metals, pesticides, polycyclic aromatic hydrocarbons (PAHs), trihalomethanes (THMs). Groundwater is the main source of drinking water for humans, and heavy metals are abundant in groundwater. They are essential micronutrients for human nutrition and their excess levels in drinking water sources can cause many cardiovascular, reproductive, and neurological diseases or cancers (Amrose 2020; Caylak 2008). The contamination of water resources with metals is directly dependent on soil or minerals, or indirectly related to industrial, agricultural anthropogenic activities and processes related to the purification of drinking water (Sener and Karakus 2017). Pesticides are intensively used against plant pests in agricultural activities and therefore pollute drinking water sources (Tokatli 2021). Due to prolonged exposure to pesticides in humans, significant reproductive, nervous and immune system diseases or cancers occur (Kim et al. 2017). PAHs pollute water resources through anthropogenic pollution or the biological transformation of fossil fuel products. Long-term exposure to PAHs with drinking water causes harmful toxicological, carcinogenic and mutagenic effects on human health (WHO 2003). Ozone, chlorine, chlorine dioxide and chloramines are added to drinking water to neutralize microbial contamination. Chlorine is one of the most widely used disinfectant in Turkey. However, chlorine reacts with natural organic or inorganic substances in water to form haloacetic acid, bromide and THMs harmful to human health (Caylak and Tokar 2012). These disinfection end products are very harmful and have carcinogenic and mutagenic effects (DeCastro Medeiros et al. 2019).
Many chemical parameters are being studied to determine the quality of water resources. However, considering these parameters, evaluating and interpreting them individually is a rather difficult and time-consuming process. Therefore, recently, many studies have been evaluating the overall quality of waters with a single figure such as the Water Quality Index (WQI) in order to express water quality in a more practical, understandable way (Bharti and Katyal 2011; Varol and Davraz 2015). Various methods are used to estimate the potential health risks of pollutants in drinking water and to divide the effects into non-carcinogenic and carcinogenic. In non-carcinogenic risk assessment Hazard quotient (HQ) is used and calculated by the ratio of the estimated dose of a pollutant to the dose level of appreciable risk (Reference dose, RfD). On the other hand, in carcinogenic risk (CR) assessment, the probability of developing any type of cancer as a result of a person's long-term exposure to a carcinogen is measured (US EPA 1998; 1999).
In this study, the drinking water samples of Cankiri analyzed to determine the chemical and microbiological parameters and performed the comparison of those parameters with the Turkish legislation and World Health Organization (WHO) criteria. WQI was determined, and carcinogenic or potential health risks of heavy metasl, pesticides, PAHs, THMs were ascertained with the HQ and CR indices.
Site characterization and sampling
The study area is the Guldurcek dam, which is the main source of drinking water in Cankiri city, and it is geographically located in the Orta district of Cankiri (40º 30' 08.45'' - 41º 32' 27.56'' N, and 32º 30' 42.56'' - 33º 26' 17.46'' E) (Figure 1). The geological structure of the city is gypsum series belonging to the third geological period. The Galatia Massif, consisting of lava, tuff and conglomerates in the composition of andesite, was formed at mesozoic periods. Groundwater within the study area is located in sedimentary rocks with high permeability (PDEF 2010; MTA 2010).
Guldurcek Dam and Treatment Plant were opened in 2010 to fulfill the drinking water demand of Cankiri city. In 2020 and 2021, the raw and purified water samples were collected monthly from the dam outlet, and treatment plant according to approved sampling procedures. The water samples were collected in 2-liter plastic bottles, were cleaned and pre-washed with 20% nitric acid (HNO3) and double distilled water. All samples were filtered and three drops of HNO3 were added and stored at 4 ° C before analysis. For microbiological analysis, the samples were collected in 1-liter sterilized polypropylene bottles and added 0.5 ml of 10% Na2SO32-.
The procedure of analyses
The physicochemical parameters of water samples were analyzed according to standard procedures of Turkish legislation A2 criteria (ISKAY 2019) and APHA (2017). pH, total dissolved solids and were measured locally by with multi-parameter meter (Hach lange HQ4OD). The determination of surfactants and ammonium were performed by colorimetrically with spectrophotometry at 652 and 410 nm (Hach DR/2500 Spectrophotometer, USA). Ion analyzer (Dionex DX-600, USA) were used to analyze of phosphates and nitrates-nitrites. Alkalinity/total hardness and sulphates were measured by volumetric titration and turbidimetric method, respectively. Biochemical/chemical oxygen demands were determined by five days incubation method and open reflux method, respectively.
The membrane filtration method was performed in microbiological analysis to determine total and fecal coliforms/Streptococci and Salmonella (Lee and Cole 1994).
Atomic absorption spectrophotometry was used to analyze of heavy metals (Perkin Elmer HGA 700, USA). The pesticide levels were determined by USEPA Method 507 and 508, using gas chromatography (HP Agilent 6890N, USA). The concentrations of PAHs and benzene/THMs were estimated by USEPA Method 550 and 551 using high performance liquid chromatography (Shimadzu LC-10 HPLC, Japan) and gas chromatography (HP Agilent 6890N, USA), respectively.
Statistical analysis
The analysis dataset of raw and purified water of three years were obtained from the Cankiri Municipality for this study. For the descriptive statistical analysis, the SPSS 22.0 for Windows software program was used.
Risk assessments
To bring out the impact of the water analysis, this study employed several water quality and health indices to estimate the potential health risk of pollutants in water samples. These risk assessment can profoundly demonstrate the effect of pollutants on humans and other systems. We performed WQI, HQ and CR assessments.
Water quality index (WQI)
To calculate WQI, the physicochemical parameters and heavy metals were used (Tyagi et al. 2013). The WQI values classified as excellent water quality (under 25), good water quality (the range 26-50), poor water quality (the range 51-75), very poor water quality (the range 76-100), and unsuitable for drinking purpose (the above 100). In this case, appropriate treatment techniques will be required for the water to be used for domestic purposes. This calculation can be estimated as follows:

Human health risk assessment
In this study, the possibility of negative health effects of heavy metals in drinking water was determined using health risk assessments. EPA has recommended two main non-carcinogenic indicators as hazard coefficient (HQ) and hazard index (HI). The HQ is defined as the ratio of the average daily dose (ADD) and the reference dose (RfD) for human exposure to each heavy metal. On the other hand, HI is used to estimate the total non-carcinogenic risk and can be determined by summing the HQs of exposure through ingestion, inhalation, and dermal chronic daily intakes (CDI) of pollutants in water sources (US EPA 1998; Caylak E 2012). The basic equations for the route of ingestion by drinking water and exposure by dermal contact are indicated here. In the methods established by the US EPA (2004), the following equations (Eqs.) were used to calculate the CDI ingestion and dermal, respectively:
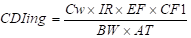
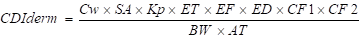
[The abbreviations in Eqs. are CDIing/derm (mg/kg day), Cw (concentration of metal in drinking water, μg/L), IR (ingestion rate, 2 L/day), EF (exposure frequency-days/year, 365 or 350 oral/dermal), BW (body weight, 70 kg), AT (averaging time, 25550 days), SA (skin surface area, 18000 cm2), ET (exposure time during bathing and shower, 0.25 hour), ED (exposure duration, 30 year), and CF1/ CF2 (μg to mg-mass conversion factor/unit conversion factor-L/1,000 cm3, 0.001). According to USEPA database Kp values are 1x10⁻³ cm/hr for Al, As, CN, Fe, Hg, Se, and V; 2x10⁻⁴ cm/hr for Ni.]
Eqs. (8), (9) and (10) were used to determine HQ (ingestion/dermal) and HI. If HQ exceeds one value, the non-carcinogenic effects of the metal are significant. To assess the total potential non-carcinogenic risks, HI is determined, which is the sum of the HQs obtained by ingestion and dermal absorption. HI> 1 indicates that heavy metals have the potential for a negative impact on human health.
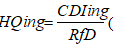
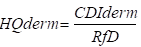

[RfD (reference dose of each heavy metal, mg/kg day). The ingestion reference dose (RfDing) values of heavy metal were obtained from the USEPA (Table 3). In order to determine the dermal absorption reference dose (RfDderm) of each metal, RfDing was multiplied by the gastrointestinal absorption factor (ABSg) (US EPA 2004)]
Carcinogenic risk (CR) through ingestion and skin exposure of As and through the ingestion of PAH, THMs and benzene in drinking water can be estimated by the following Eqs. The calculated CI ratio is greater than 1.00E-05 indicates a possible potential carcinogenic risk, while the fact that it is less than one indicates that there is no possible carcinogenic effect on human health in the samples (US EPA 1999).


[CDIing/derm (mg/kg day), SF (carcinogenic slope factor for As ingestion/dermal and PAHs, THMs and benzene through ingestion, mg/kg/day-1 (Table 3 and 4) (US EPA 1999)].
In Table 1, the data of the raw and purified water samples examined in our study are shown by comparing them with the Turkish legislation and WHO limits (ISKAY 2019; WHO 2011). WQI analyses were performed by using the physicochemical and heavy metal parameters of the water samples (Table 2). In addition, Table 3 displays the most important heavy metal variables for each water samples. The health risk assessments (HQ and HI) for heavy metals and cancer risk assessment for As are presented in Table 4. Table 5 also shows cancer risk assessment for PAHs, THMs and benzene.
In the present study (Table 1), the physicochemical parameters were below the limits of Turkish and WHO criteria (ISKAY 2019; WHO 2011). The color value for raw water in 2021 (18.9 Pt/Co) was higher than WHO criteria (color 15 Pt/Co). It is undesirable visible color of an ideal drinking water. The color of drinking water is due to organic substances contained in the structure of soil and rock, iron and other metals; industrial pollution and high levels of disinfection agents used (WHO 2011). The high result in color of our study may have been found to be high due to agricultural activities in the spring period and runoff caused by high rainfall in the Guldurcek dam basin. In raw water samples of all years, the levels of phenolic substance (ranged 1.8-2.0 μg/L) and biochemical O2 demand (ranged 1.0-7.3 mg/L) were higher than the Turkish and WHO limits (1 μg/L and 5 mg/L, respectively) (ISKAY 2019; WHO 2011). Total organic carbon values in all samples (ranged 4.00-5.41 mg/L) were slightly higher the Turkish legislation limits (ISKAY 2019). High phenolic compounds, biochemical O2, and total organic carbon levels demand in water are caused by the decomposition of dead plants and animals and are indicative of organic load in water (Chen 2021). It is a result of the water flow to the Guldurcek dam basin from the agricultural land where these decomposing organic substances are washed away. Filipov et al. (2002) found phenol concentrations to be between 0.4 and 0.6 µg/L in the analyses carried out by in the drinking water of Moscow, Russia. Belayneh et al. (2020) determined the concentrations of phenol (ranged 2.73-3.64 µg/L) in drinking water of Jimma district in Ethiopia. High phenol levels in drinking water may increase depression, asthma, digestive tract infections and morbidity risk (Hrudey 2009).
Table 1 also shows microbiological contamination values, and the results in all samples for total and fecal coliforms/streptococci and Salmonella spp., were resulted with no bacteriological contamination.
The analyses of heavy metal indicated that barium, beryllium, boron, calcium, chloride, cobalt, copper, fluoride, manganese, magnesium, sodium, sulfur, and zinc levels were normal range limits of Turkish and WHO limits (ISKAY 2019; WHO 2011). CN, Fe, Se, Vn, total pesticide-PAH- THM levels were determined as slightly above Turkish and WHO legislation. Hg (ranged 4.2-9.7 μg/L), Ni (ranged 7.3-25 μg/L), and As (11.22-13.84 μg/L) were above Turkish and WHO legislation.
Heavy metals are released into groundwater from various natural and anthropogenic sources. The problem of water pollution due to heavy metals is largely observed in different regions of the world with the development of mining, smelting and other industrial activities. Metal pollution threatens the health and life of animals and humans through the water and food chain. The presence of high concentrations of heavy metals in groundwater can have negative effects on human health and make this water undrinkable. High concentration of these metals can be dangerous to human health and cause bad effects such as asthma, pneumonia, vomiting, vision problems and health problems. Long-term exposure to heavy metals increases the risk of endocrine and metabolic disorders, skin, liver, heart, joint diseases and cancers. We also determined that the levels of As, CN, Fe, Hg, Ni, Se and Vn were undesirable for human health.
High pollution of water resources with As occurs due to erosion of rocks containing As by water as well as anthropogenic industrial and agricultural activities. Since industrial and agricultural activities are very few around the Cankiri drinking water source, the main cause of As pollution is due to the geomeorphological structure of Cankiri (Wang and Mulligan 2009). In our previous study, our research revealed that the drinking water samples of Cankiri city and Kursunlu town contain higher As concentrations (10–30 µg /L) than the permissible limit set by the WHO (Wolz 2009; Caylak 2012).
Ni contamination of drinking water is caused by pipes and metal fittings used during treatment and distribution (WHO 2011). Mohammadi et al. (2019) determined higher Ni concentrations (0.43 and 3.47 µg/L) in analyses in drinking water of Khorramabad, Iran than the limits of WHO. They reported that the carcinogenic risk for Ni was higher than the acceptable limit (1x10⁻⁶).
Cyanide is one of the most harmful substances in the world, and drinking water is naturally polluted by plants, fungi and bacteria or decontaminated by sewage and industrial waste. Kwaansa-Ansah et al. (2017) determined free cyanide levels in dam and borehole water samples (0.160 and 180 µg/L) collected from Kenyasi, Ghana higher than the WHO limits.
Iron is richly present in the earth's crust and is known to undergo a high rate of transition from rock layers to water. Drinking water is also polluted by industrial and urban sewage wastes or mining and agricultural activities (Jaishankar et al. 2014). Gupta et al. (2017) found higher Fe concentrations (160.4 µg/L than the permissible limit of WHO) in analyses in drinking water in various regions of India.
Mercury (Hg) is a toxic metal, and drinking water is polluted by geogenic inputs (lithosphere and fossil fuels) and industrial waste. Khattak et al. (2021) identified mercury (Hg) concentration (2.0 µg/L) in groundwater (shallower aquifer) of District Swabi, Pakistan exceeded WHO recommended limits.
Selenium is a naturally occurring element that is widely found throughout the rocks and soils of the Earth. Selenium can be dissolved by the decomposition of minerals in the soil or rock, and can be found in groundwater. Golubkina et al. (2018) determined high Se levels (range from 1.2 to 18.6 μg/L) in drinking water of Dorno-Gobi aimag, Mongolia, which exceeded the WHO permissible limits.
Vanadium is a ubiquitous metal and high concentrations of V have been found in groundwater, especially in volcanic areas. Arena et al. (2015) found higher V in groundwater from Mt. Etna, Italy (ranged 15.6-182 μg/L) than the permissible limits of WHO.
Table 6 and 7 shows the calculated WQI values of the raw and purified water of Cankiri to evaluate their range (poor/good/excellent water). WQI rating for physicochemical parameters was found good degree all samples [raw water 2020 and 2021 (42.04, 40.44) and purified water 2020 and 2021 (41.69, 43.33)]. When the heavy metals were used to calculate the WQI value, purified water 2020 and 2021 showed poor water quality due to high arsenic, iron, mercury and selenium levels found in this sample [raw water 2020 and 2021 (27.58, 60.18) and purified water 2020 and 2021 (27.22, 53.59)].
The levels of pesticides, PAHs, THMs and benzene in the water samples were determined in normal range compared to Turkish and WHO criteria, while total pesticide (ranged 0.0055-0093 μg/L), total THM [(54.75 μg/L) in 2020’s purified water and (56.89 μg/L) in 2021’s] were slightly below (ISKAY 2019; WHO 2011). The increase in total pesticides in water samples may be caused by the fact that pesticides, which are used at a high rate in agricultural areas in Cankiri, pass into the soil and surface waters. Chlorination is preferred in Cankiri water treatment plant for microbial disinfection. Chlorine reacts with natural organic substances found in water to produce disinfection by-products such as trihalomethanes (Uyak 2006). Probably, the use of excess chlorine in the plant may have increased the total THMs concentration in the treated water.
In this study, we conducted health risk assessments to determine the pollutants in water samples. Considering that some heavy metal concentrations are significantly higher in drinking water samples of Cankiri city (Table 3), HQ and HI values were calculated. In general, if HQ or HI value is greater than 1; it indicates potential adverse health effects and needs for further study. For ingestion pathway, As-non cancer of HQ values [raw water 2021 (1.192) and purified water 2021 (1.068)] were higher than 1. The heavy metal of the HQ values (ranged 1.018E-01–9.215E-01) for oral/dermal route was slightly below unity (As-non cancer, CN, Fe, Hg and Ni). HI values of As non-cancer [raw water 2021 (1.644) and purified water 2021 (1.473)] and Hg [purified water 2020 (1.053)] were also higher than 1. The heavy metal of the HI values (ranged 1.566E-01–9.330E-01) for oral/dermal route was slightly below unity (As-non cancer, CN, Fe, Hg and Ni). With the exception of Fe and Hg, these results indicate that heavy metals measured in high amounts in drinking water samples may pose little health risk to local consumers through ingestion and dermal contact.
Cancer risk (CR) can be defined as the upper limit probability that an individual will develop cancer due to lifelong exposure to a potential carcinogen. The range of carcinogenic risks acceptable or tolerable by the US EPA (2004) was 10−6 to 10−4. In this study, the oral CDI Eqs. are multiplied by the slope factors of pollutants to obtain CRs (Table 4). In addition, if the CR values above 10-5, it is estimated that this pollutant have the potential carcinogenic risk. CR assessments in our study indicated that As (ranged 2.168E−05-2.674E−04) have risk for people of Cankiri (Table 3), similar to the result of concentration in drinking water compared to Turkish and WHO criteria in Table 1. Prolonged exposure to drinking water arsenic can cause skin lesions, neuropathy, diabetes, hypertension, cardiovascular and cerebrovascular diseases, and can increase the incidence of skin, lung, liver, kidney, and bladder cancers (Liao 2009). Therefore, necessary measures should be taken to maintain a healthy water ecosystem for local residents who use drinking water, and especially for children, against the high content of As in drinking water. The estimated cancer risks of long-term exposure to PAHs by ingestion have been calculated and shown in Table 5 (ranged 0-4.95-E05). CR values of B[ghi]P and total PAHs [purified water 2021 (4.95-E05)] were higher than 1.00 E-05 for ingestion pathway. It has been revealed that PAHs in water samples of Cankiri city have a slight risk of cancer. CR determined for THMs in drinking water of Cankiri city range were 0-2.20E-05 and displayed in Table 5. Considering the carcinogenic health risk, the values were higher than 1.00E-05 for total THMs [purified water 2020 (2.20-E05), purified water 2021 (1.82-E05)]. These results showed that long-term total THMs exposure via ingestion route in drinking water posed little cancer risk for Cankiri consumers.
The use of water due to the increasing population and industrialization on Earth is increasing every day, as a result of which unconscious uses and environmental pollution reaching large sizes are formed. These resulting impurities greatly damage the availability of surface waters. In particular, in settlements where surface waters are preferred as a source of drinking water, it is necessary to supply water to the network after it has been determined by analyzes that it has undergone absolute healthy treatment. In this study, the physicochemical and microbiological character, and main pollutants of drinking water of Cankiri city were examined for human health and cancer risk estimation. Various water quality and health indices have been used to determine the potential health risks of these pollutants. This risk assessment can deeply show the impact of pollutants on humans and other systems. For this purpose, we performed the water quality index WQI, HQ and CR assessments. The levels of As, Hg and Ni were higher than their permissible limits of Turkish legislation and WHO. The WQI rating using physicochemical parameters determined the quality of the water to be good. When the heavy metals were used to calculate the WQI value, water quality was determined poor quality due to high heavy metal levels in samples. The health risk assessments (HQing and HI indices) indicated that the As and Hg in drinking water can cause health problems. As-non cancer, CN, Fe, Hg and Ni of the HQ and HI values for oral/dermal route were slightly below unity and indicated the low risk for consumers.
The carcinogenic risk assessment conducted for As in drinking water Cankiri city has shown that As is the most important pollutant and poses a chronic health risk in the use of drinking water. When the pesticides, PAHs, THMs and other organic chemicals were examined, it was found that there was no chronic health risk in terms of cancer risk. However, the results of B[ghi]P, total PAHs, and total THMs in drinking water of Cankiri might exert potential carcinogenic risk. Therefore, it suggested that the THMs concentration can be reduced by improving processes and especially pretreatment in water purification systems and/or by using alternative disinfectants.
Health and carcinogenic risk assessments can be a very useful tool for revealing the quality of water. As a result of these analyzes, advanced treatment methods should be used due to the insufficient traditional treatment methods in Cankiri province to provide surface waters contaminated with heavy metals to drinking water networks in a healthy way. For this purpose, it is mandatory to invest in new treatment plants.
All procedures performed in this study were in accordance with the ethical standards of the institutional and/or national research committee and with the 1964 Helsinki declaration and its later amendments or comparable ethical standards. No animal or human studies were carried out by the authors for this article.
Funding
None
Authors’ contributions
EC: conceptualization, methodology, data curation, data analysis, writing original draft preparation; conceptualization, methodology, writing review and editing, supervision, funding acquisition; Data collection, data curation; review and editing, funding acquisition; data analysis and editing; map conception and editing, methodology, review and editing; BOS: methodology, review and editing; methodology, review and editing. The author read and approved the final manuscript.
The data analyzed during the current study are available from the corresponding author on reasonable request.
Not applicable.
Not applicable.
Not applicable.
The authors declare that they have no known competing financial interests or personal relationships that could have appeared to influence the work reported in this paper.
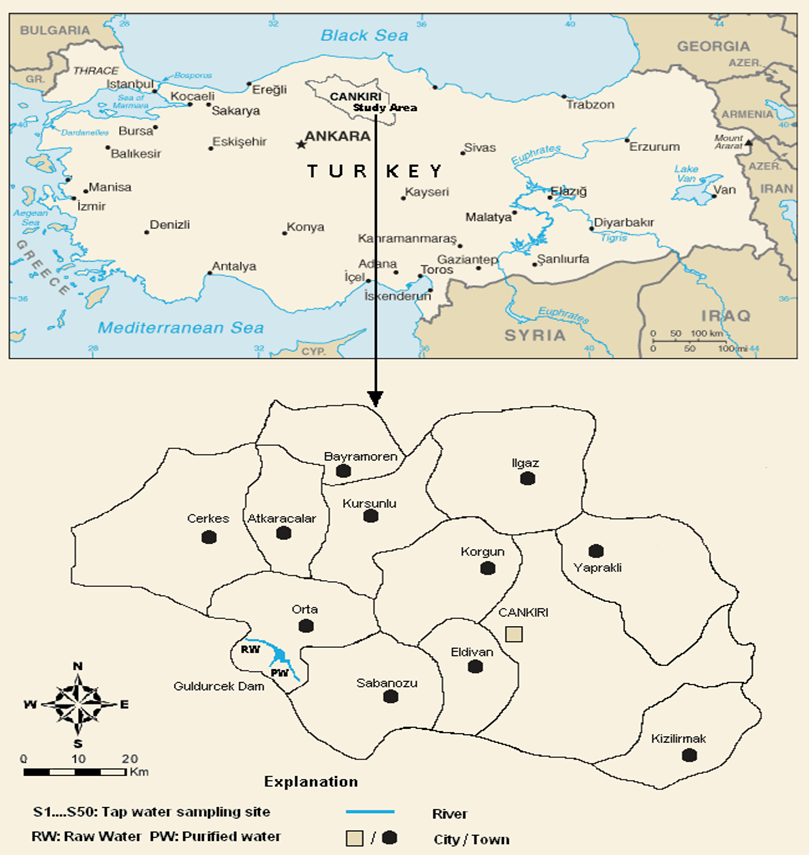
Table 1. The water quality parameters of Cankiri province, Turkey, compared with TR and WHO limits.
Parameters | Units | LOQ | Raw water 2020 | Purified water 2020 | Raw water 2021 | Purified water 2021 | TRa | WHOb |
pH | - | - | 8.44 | 8.09 | 8.26 | 8.04 | 5.5-9.0 | 6.5-8.5 |
Total dissolved solids | mg/L | 5.0 | 7.5 | 4.8 | 7.2 | 4.6 | 25 | 1000 |
Conductivity | μS/cm | 5.0 | 183.4 | 192.5 | 182.4 | 196.1 | 1500 | 400 |
Surfactants | mg/L | - | 0.027 | 0.028 | 0.034 | 0.035 | 0.2 | ne** |
Nitrate | mg/L | 0.05 | 0.43 | 0.85 | 0.50 | 0.92 | 50 | 50 |
Nitrite | mg/L | 0.007 | 0.009 | 0.003 | 0.006 | 0.005 | 0.5 | 3 |
Phenolic substance | μg/L | 1.0 | 2.0 | 1.9 | 1.8 | 1.9 | 1 | 1 |
Chemical O2 demand | mg/L | - | 0.95 | 1.2 | 1 | 1.4 | 30 | ne** |
Biochemical O2 demand | mg/L | - | 5.4 | 1 | 7.3 | 1.3 | 5 | ne** |
SO42- | mg/L | 0.01 | 3.5 | 3.8 | 4.92 | 3.83 | 150 | 400 |
SO32- | mg/L | 0.001 | 0.001 | 0.001 | 0.001 | 0.001 | 50 | 50 |
PO43- | mg/L | 0.01 | 0.03 | 0.01 | 0.02 | 0.03 | 0.7 | ne** |
Kjeldahl nitrogen | mg/L | 0.05 | 0.04 | 0.52 | 0.06 | 0.63 | 2 | ne** |
Ammonium | mg/L | 0.01 | 0.026 | 0.025 | 0.033 | 0.03 | 1 | 1.5 |
Color | Pt/Co | 2 | 11.6 | 4.2 | 18.9 | 5.5 | 50 | 15 |
Alkalinity | CaCOᴈ mg/L | - | 91.8 | 81.9 | 92.3 | 87.4 | 600 | 600 |
Hardness | Fsᵒ | - | 95.66 | 93.12 | 93.22 | 86.13 | 600 | 600 |
TOC | mg/L | 1.0 | 5.41 | 4.27 | 4.60 | 4.49 | 4 | ne** |
Total Coliform bacteria | cfu/100 ml | - | 0 | 0 | 0 | 0 | 0 | 0 |
Fecal Coliform bacteria | cfu/100 ml | - | 0 | 0 | 0 | 0 | 0 | 0 |
Fecal streptococci | cfu/100 ml | - | 0 | 0 | 0 | 0 | 0 | 0 |
Salmonella spp. | cfu/5000 ml | - | 0 | 0 | 0 | 0 | 0 | 0 |
Arsenic (As) | μg/L | 2.0 | 13.84 | 11.56 | 12.52 | 11.22 | 10 | 10 |
Barium (Ba) | μg/L | 1 | 26 | 24.6 | 28 | 32 | 1000 | 700 |
Beryllium (Be) | μg/L | 2.0 | 12 | 12 | 24 | 24 | ne** | ne** |
Boron (B) | μg/L | 1.0 | 1.4 | 3.45 | 1.6 | 3.6 | 1000 | 500 |
Calcium (Ca) | mg/L | 2.0 | 28.57 | 27.76 | 27.84 | 1.08 | 75 | 75 |
Chloride (Cl) | μg/L | 0.45 | 0.55 | 0.95 | 0.48 | 0.97 | 200 | 5000 |
Chromium (Cr) | μg/L | 0.45 | 0.90 | 0.98 | 0.55 | 1.26 | 50 | 50 |
Cobalt (Co) | μg/L | 2.0 | 3 | 0.69 | 2.5 | 0.72 | ne** | ne** |
Copper (Cu) | μg/L | 40 | 40 | 81 | 40 | 85 | 2000 | 2000 |
Cyanide (CN) | μg/L | 2.0 | 16 | 16 | 20 | 20 | 50 | 70 |
Iron (Fe) | μg/L | 7.0 | 7.0 | 46.33 | 7.0 | 45.2 | 200 | 300 |
Manganese (Mn) | μg/L | 0.3 | 0.3 | 0.3 | 0.3 | 0.3 | 50 | 400 |
Magnesium (Mg) | mg/L | 0.4 | 5.80 | 8.87 | 6.25 | 8.93 | 50 | 50 |
Mercury (Hg) | μg/L | 0.3 | 4.2 | 9.7 | 4.5 | 8.6 | 1 | 6 |
Nickel (Ni) | μg/L | 1.5 | 25 | 7.3 | 28 | 8.6 | 20 | 70 |
Selenium (Se) | μg/L | 2.0 | 9.9 | 9.8 | 7.5 | 9.75 | 10 | 10 |
Sulfur (S) | mg/L | 0.1 | 2.5 | 2.04 | 2.6 | 2.1 | 250 | 250 |
Vanadium (V) | μg/L | 2.0 | 72 | 65 | 55 | 48 | ne** | 140 |
Zinc (Zn) | μg/L | 0.01 | 8 | 6.9 | 10 | 8.2 | 3000 | 3000 |
Total pesticide | μg/L | 0.01 | 0.0086 | 0.0072 | 0.0093 | 0.0055 | 1 | 1 |
Paration-methyl | μg/L | 0.001 | 0.0058 | 0.0047 | 0.0061 | 0.0029 | 0.01 | 0.01 |
Paration-ethyl | μg/L | 0.001 | 0.0028 | 0.0025 | 0.0032 | 0.0026 | 0.01 | 0.01 |
Total PAHs | μg/L | 0.01 | 0.0008 | 61.56 | 0.0007 | 79.25 | 0.1 | 0.2 |
Fluoranthene | μg/L | 0.0003 | 0.0008 | 0.0025 | 0.0007 | 0.0022 | ne** | ne** |
B[b]F | μg/L | 0.0003 | <0> | <0> | <0> | <0> | ne** | ne** |
B[k]F | μg/L | 0.0003 | <0> | <0> | <0> | <0> | ne** | ne** |
B[ghi]P | μg/L | 0.0003 | <0> | 58.22 | <0> | 75.67 | ne** | ne** |
I[cd]P | μg/L | 0.0003 | <0> | 2.82 | <0> | 3.12 | ne** | ne** |
B[a]P | μg/L | 0.0003 | <0> | 0.518 | <0> | 0.459 | 0.01 | 0.7 |
Benzene | μg/L | 0.1 | 0 | 0 | 0 | 0 | 10 | 10 |
Total THMs | μg/L | 0.1 | 12.53 | 54.75 | 14.47 | 56.89 | 100 | 100 |
Chloroform | μg/L | 0.1 | 0.26 | 8.79 | 0.34 | 12.54 | ne** | 300 |
Bromodichloromethane | μg/L | 0.1 | 0.87 | 2.46 | 0.58 | 2.67 | ne** | 60 |
Dibromochloromethane | μg/L | 0.1 | 0.35 | 2.87 | 0.42 | 1.83 | ne** | 100 |
Bromoform | μg/L | 0.1 | 0.59 | 3.45 | 0.72 | 2.31 | ne** | 100 |
a A2 criteria- Turkish legislation for water source and ground waters (ISKAY 2019). b Guideline values established by the World Health Organization for drinking water (WHO 2011). * Below detection limits of the method, ** Not established,
Table 2 The most important heavy metal variables for each sample of the raw and purified water of Cankiri.
Sample | Important variables | Slightly important variables |
Raw water 2020 | As, Hg, Ni | CN, Se, Vn, Total pesticides |
Purified water 2020 | As, Hg, Ni | CN, Fe, Se, Vn, Total values of pesticides, PAHs and THMs |
Raw water 2021 | As, Hg, Ni | CN, Se, Vn, Total pesticides |
Purified water 2021 | As, Hg, Ni | CN, Fe, Se, Vn, Total values of pesticides, PAHs and THMs |
Table 3 HQ, HI, and CR assesment for heavy metals of water samples of Cankiri.
Heavy Metal | Sample | HQing | HQderm | HI=ΣHQs | Cancer Risk |
Al (1b/- c) | Raw water 2020 | 3.705E-05 | - | 3.705E-05 | - |
| Purified water 2020 | 1.400E-03 | - | 1.400E-03 | - |
| Raw water 2021 | 3.420E-05 | - | 3.420E-05 | - |
| Purified water 2021 | 1.342E-03 | - | 1.342E-03 | - |
As-cancer (1500d /3660e) | Raw water 2020 | 2.636E-04 | 3.890E-06 | - | 2.674E-04 |
| Purified water 2020 | 2.202E-04 | 3.249E-06 | - | 2.234E-04 |
| Raw water 2021 | 2.384E04 | 3.519E-06 | - | 2.419E04 |
| Purified water 2021 | 2.137E04 | 3.154E-06 | - | 2.168E04 |
As-noncancer (0.3b /0.285f) | Raw water 2020 | 1.317 | 4.995E-02 | 1.817 | - |
| Purified water 2020 | 1.101 | 4.172E-02 | 1.518 | - |
| Raw water 2021 | 1.192 | 4.518E-02 | 1.644 | - |
| Purified water 2021 | 1.068 | 4.049E-02 | 1.473 | - |
CN (5.4b /6.3f) | Raw water 2020 | 8.444E-02 | 7.238E-02 | 1.568E-01 | - |
| Purified water 2020 | 8.444E-02 | 7.238E-02 | 1.568E-01 | - |
| Raw water 2021 | 1.056E-01 | 9.048E-02 | 1.961E-01 | - |
| Purified water 2021 | 1.056E-01 | 9.048E-02 | 1.961E-01 | - |
Fe (7b /7f) | Raw water 2020 | 2.850E-02 | 2.850E-02 | 5.700E-02 | - |
| Purified water 2020 | 1.886E-01 | 1.886E-01 | 3.772E-01 | - |
| Raw water 2021 | 2.850E-02 | 2.850E-02 | 5.700E-02 | - |
| Purified water 2021 | 1.886E-01 | 1.886E-01 | 3.772E-01 | - |
Hg (0.3b /0.021f) | Raw water 2020 | 3.990E−01 | 5.700E-02 | 4.560E−01 | - |
| Purified water 2020 | 9.215E−01 | 1.316E-01 | 1.053 | - |
| Raw water 2021 | 4.275E−01 | 6.107E-02 | 4.885E−01 | - |
| Purified water 2021 | 8.170E−01 | 1.167E-01 | 9.330E−01 | - |
Ni (20b /0.8f) | Raw water 2020 | 2.800E-01 | 1.050E-03 | 2.811E-01 | - |
| Purified water 2020 | 6.667E-02 | 2.425E-03 | 6.909E-02 | - |
| Raw water 2021 | 3.000E-01 | 1.125E-03 | 3.011E-01 | - |
| Purified water 2021 | 5.733E-02 | 2.150E-03 | 5.944E-02 | - |
Se (5b /0.15f) | Raw water 2020 | 3.960E-02 | 1.320E-02 | 5.280E-02 | - |
| Purified water 2020 | 3.920E-02 | 1.307E-02 | 5.227E-02 | - |
| Raw water 2021 | 3.000E-02 | 1.000E-02 | 4.000E-02 | - |
| Purified water 2021 | 3.900E-02 | 1.300E-02 | 5.200E-02 | - |
V (5b /0.07f) | Raw water 2020 | 2.880E-02 | 2.057E-02 | 4.337E-02 | - |
| Purified water 2020 | 2.600E-02 | 1.857E-02 | 4.457E-02 | - |
| Raw water 2021 | 2.200E-02 | 1.571E-02 | 3.771E-02 | - |
| Purified water 2021 | 1.920E-02 | 1.371E-02 | 3.291E-02 | - |
b RfDing (μg/kg day), d/e slope factor for As through ingestion/dermal (mg/kg/day)-1, f RfDderm (μg/kg day), c , ” - “ indicate that a cancer slope factor or RfD has not been established
Table 4 Human health toxicological data for PAHs, THMs and benzene (IRIS 2009).
Compounds | Slope factors (SF) [mg/kg/day]-1 |
B(p)F | 0.23 |
B(k)F | 0.23 |
B(ghi)P | 0.023 |
I(cd)P | 0.23 |
B(a)P | 2.3 |
CHCl3 | 0.01 |
CHBr3 | 0.0079 |
DBCM | 0.0084 |
BDCM | 0.062 |
Benzene | 0.055 |
Table 5 CR assessments for PAHs, THMs and benzene in raw and purified water of Cankiri.
Sample Chemicals | Raw water 2020 | Purified water 2020 | Raw water 2021 | Purified water 2021 | |
B[b]F | NDg | ND | ND | ND | |
B[k]F | ND | ND | ND | ND | |
B[ghi]P | ND | 3.81E-05 | ND | 4.95E-05 | |
I[cd]P | ND | 1.85E-09 | ND | 2.05E-09 | |
B[a]P | ND | 3.41E-08 | ND | 3.01E-08 | |
ΣPAHs | ND | 3.81E-05 | ND | 4.95E-05 | |
CHCl3 | 7.41E-07 | 2.51E-06 | 9.69E-07 | 3.57E-06 | |
CHBr3 | 1.42E-06 | 8.28E-06 | 1.73E-06 | 5.55E-06 | |
CHBr2Cl | 8.40E-07 | 6.89E-06 | 1.01E-06 | 4.39E-06 | |
CHBrCl2 | 1.54E-06 | 4.36E-06 | 1.03E-06 | 4.73E-06 | |
ΣTHMs | 4.54E-06 | 2.20E-05 | 4.73E-06 | 1.82E-05 |
g not determined
Table 6 The levels of water quality index.
WQI value | Rating of water quality | Grading |
0-25 | Excellent water quality | A
|
26-50 | Good water quality | B
|
51-75 | Poor water quality | C
|
76-100 | Very poor water quality | D
|
Above 100 | Unsuitable for drinking purpose | E |
Table 7 The water quality index (WQI) values of the raw and purified water of Cankiri, Turkey
Sample
Index | Raw water 2010 | Purified water 2010 | Raw water 2020 | Purified water 2020 | Raw water 2021 | Purified water 2021 |
Physicochemical parameters | 43.33 | 41.69 | 42.04 | 40.44 | 41.69 | 43.33 |
Heavy metals | 35.91 | 81.03 | 27.58 | 60.18 | 27.22 | 53.59 |