Current Issue : Article / Volume 1, Issue 1
Case Report | DOI: https://doi.org/.
Summaries, Analysis and Simulations of Recent COVID-19 Epidemic in Shanghai
School of Mathematics and Physics, University of Science and Technology Beijing, Beijing 100083, PR China.
Correspondng Author: Lequan Min
Citation: Lequan Min, (2023). Summaries, Analysis and Simulations of Recent COVID-19 Epidemic in Shanghai. Journal of Pulmonology and Disorders.1(1).
Copyright: © 2023, Lequan Min, this is an open access article distributed under the Creative Commons Attribution License, which permits unrestricted use, distribution, and reproduction in any medium, provided the original work is properly cited.
Received Date: 2022-12-14, Received Date: 2022-12-14, Published Date: 2023-01-30
Abstract Keywords: Shanghai COVID-19, infection transmission rates, infection blocking rates, recovery rates, death rates, modeling, simulations.
Abstract
Background: After successfully preventing the spread of five wave COVID-19 epidemics in Shanghai, Omicron and Delta variants have been causing a surge COVID-19 infection in this city recently. Summaries, analysis and simulations for this wave epidemic are important issues.
Methods: Using differential equations and real word data, this study modelings and simulates the recent COVID- 19 epidemic in Shanghai (March 1 â¼ June 14, 2022), estimates transmission rates, recovery rates, and blocking rates to symptomatic and asymptomatic infections, and symptomatic (infected) individualsâ death rates. Visual simulations predict the outcomes of this wave Shanghai epidemic. It compares with the recent mainland China COVID-19 epidemics (RMCE).
Results: The simulation results were in good agreement with the real word data at the end points of 13 investigated time-intervals (day 0 to day 75). The visual simulations imply that in the last month (day 76to day 105), the blocking rates to the symptomatic and asymptomatic infections almost reach 100%, the recovery rate of symptomatic and asymptomatic infections increase significantly, and the death rate of the infected individuals decrease significantly.
The transmission rate of the symptomatic infections caused by the symptomatic individuals was much lower than the corresponding average transmission rate of the RMCE.
The transmission rate of the asymptomatic infections caused by the symptomatic individuals was much higher than the first 75 dayâs average trans-mission rate of RMCE.
The transmission rate of the symptomatic infections caused by the asymptomatic individuals was much lower than the first 75 dayâs average transmission rate and the last 30 daysâ average transmission rate of RMCE.
The transmission rate to the asymptomatic infections caused by the asymptomatic individuals was much higher than the corresponding average transmission rate of RMCE.
The average recovery rate of the symptomatic individuals was much lower than the corresponding average recovery rate of the symptomatic individuals of RMCE.
The first 30 daysâ average recovery rate of the asymptomatic individuals was much lower than the first 30 daysâ average recovery rate of RMCE.
The last 30 daysâ average recovery rate of the symptomatic individuals was higher than the last 30 daysâ average recovery rate of RMCE.
Conclusions: The average low blocking rates to the symptomatic infections, the first 30 dayâs low blocking rates to the symptomatic infections, the low recovery rates of the symptomatic individuals, and the high transmission rate of the asymptomatic infections may be the reasons to cause the rapid spread of the recent Shanghai epidemic. The last monthâs strict prevention and control strategies, the high recovery rates of symptomatic and asymptomatic infections, and the low death rates have prevented the rapid spread of thesixth wave COVID-19 epidemic in Shanghai.
Introduction
Omicron and Delta variants have been causing surge COVID-19infections in word wide. Many countries haveexperienced multiple outbreaksof the COVID- 19 epidemics caused by the variants. As of 15 May 2022, over 518 million confirmed cases of COVID-19and over six million deathshave been reportedglobally [1].
After successfully preventing the spread of five wave COVID-19epidemics in Shanghai,Omicron variants have broken through the COVID-19 prevention of this city recently.Analysis and simulations for this wave epidemic are important issues.
Since the outbreak of COVID-19 in Wuhan China, a large number of articles on modelings and predictions of COVID-19 epidemicshave been published(for examples see [2–10]). Recently, the author has used several simple differential equation models to describe successfully the dynamicsof spreads of the COVID-19 epidemics in mainlandChina [11–14].
Using the differential equation model and real word data, this study modelings and simulates the recent sixthwave COVID-19 epidemic(March 1 to April 30, 2022) in Shanghai, estimatestransmission rates, recoveryrates, and blockingrates to symptomatic and asymptomatic infections, and symptomatic individuals’ death rate. Visual simulations predict the outcomes of this wave Shanghai epidemic. It compares parallelly with the recent mainland China COVID-19 epidemics(RMCE).
Materials and Methods
The dataset of the Shanghai COVID-19 epidemic from March 1, 2022 to May 15, 2022 was collected and edited from the Health Commission of Shanghai official web- site [15]. Using the differential equation model stimulates the outcomes of the numbers of the currentsymptomatic individuals, the current asymptomatic individuals charged in medical observations, the cumulative recovered symptomatic individuals, and the cumulative asymptomatic individuals discharged from medicalobservations, and the number of the cumulative died symptomatic (infected) individuals. The equation parameters were determined by so-called minimization error square criterion described in references [11, 14]. Using virtual simulations estimates the outcomes of the spreads of the recent COVID-19 epidemic in Shanghai. Simulations and figure drawings were implemented via MATLAB programs.
Summaries, Analysis and Simulations of Recent Shanghai Epidemic
Summaries
- On January 4, 2022, the fifth wave Shanghai COVID-19 epidemic ended[12, 14, 15]. The all-symptomatic individuals in hospitals were recovered, except there were 8 asymptomatic individuals charged in medical observations.
- From January 4 to January 12, 2022. No new symptomatic infections were reported.
- During the period from January 13 to February22, 2022. On January13, two foreigninput related
Symptomatic cases were reported. They were recovered on January 24 and January 25, respectively. On January 24 and January 26, two symptomatic individuals were reported. The first case may be infected by infected foreignimport goods, and the second one was infected by the firstindividual. They were recovered on February 16 and February22, respectively.
- During the period from February 22 to February28, 2022. There were no reported symptomatic individuals; there were 10 asymptomatic individuals charged in medical observations.
- During the period from March 1 to May 15, 2022 (Sixth wave COVID-19 epidemic).
The wave epidemic ended on about June 24 (no new symptomatic and asymptomatic individuals were reported). However, on May 17 and May 19, no official COVID-19 data were announced by [15] which make us difficult to determine the number of the currentasymptomatic individuals. Hence, we only simulate the COVID-19 data during March 1 to May15, and visually simulate the COVID-19 data during March 1 to June 14 in or- der to compare with the recent mainland COVID-19epidemic [16] and the first Shanghai COVID-19 epidemic [14].
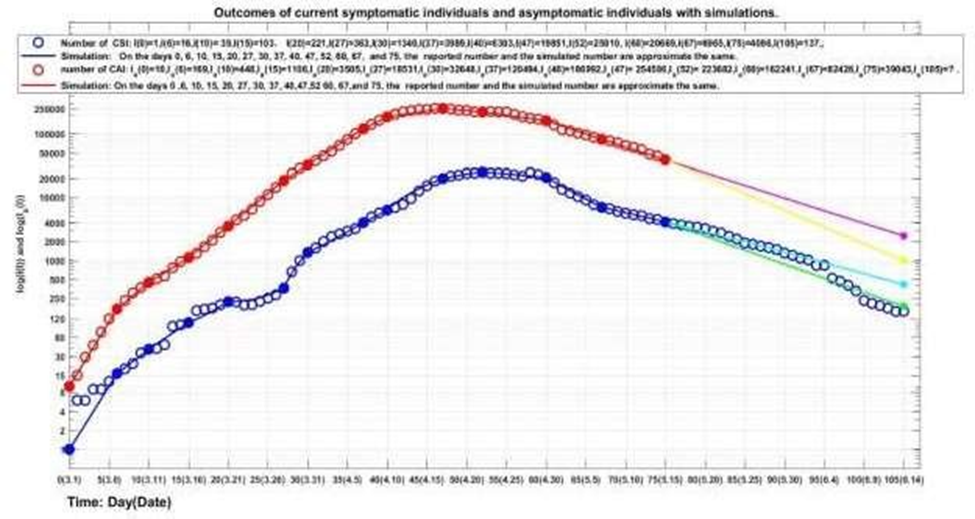
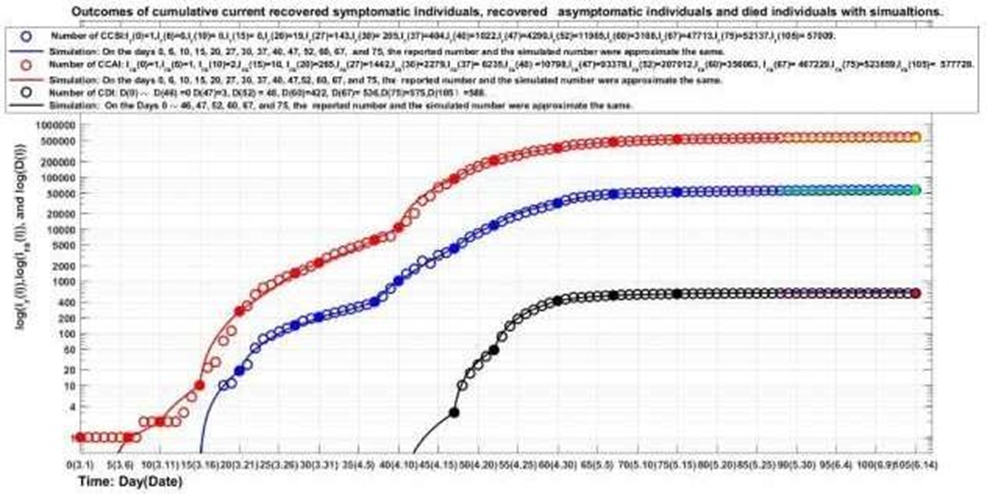
The outcomes of the numbersof the current symptomatic individuals (CSI) and the current asymptomatic individuals (CAI) chargedin medical observations are shown in Fig. 1. The outcomesof the numbers of the cumulative re- covered symptomatic individuals (CCSI), the cumulative asymptomatic individuals (CCAI) dis- charged from medical observations, and the cumulative died symptomatic individuals are shown in Fig. 2.
- On March 1 (denotedby day 0), one new symptomatic individual was reported, there were ten cumulative asymptomatic individuals charged in medical observations, and there was one asymptomatic individual discharged from the medical observations.
- On March 9 (day 8), one new asymptomatic individual discharged from medical observations, there were 306 asymptomatic individuals charged in medicalobservations, and 23 current symptomatic individuals.
- The first symptomatic individual’s recovery day was on March 19 (day 18), 10 symptomatic individuals and 72 asymptomatic individuals re- covered on that day. There were 175 current symptomatic (hospitalized) individuals and 2099 asymptomatic individuals chargedin the medical observations.
- The asymptomatic infection turning point appeared on day 44 (April 14), there were 245812 asymptomatic individuals charged in medical observations, there were 12684 symptomatic individuals in hospitals. There were 2215 cumulative re-covered symptomatic individuals, and cumulative 43768 asymptomatic individuals discharged from the medicalobservations.
- The symptomatic infection turningpoint appeared on day 52 (April 22), there were 25010 symptomatic individuals in hospitals and 223682 asymptomatic individuals charged in medical observations. There were 11965 cumulative recovered symptomatic individuals. There were 207012 cumulative asymptomatic individuals discharged from the medicalobservations. There were cumulative 48 died symptomatic individuals. The first 3died symptomatic individuals appeared on day 47.
- On the investigated end day 75 (May 15) there were 4086 symptomatic individuals in hospitals and 39043 asymptomatic individuals charged in medicalobservations. There were 52137 cumulative recovered symptomatic individuals and 523859 cumulative asymptomatic individuals dis- chargedfrom medical observations. There were 69 daily increasedsymptomatic individuals and 869 daily increased asymptomatic individuals. There were 575 cumulative died symptomatic individuals.
Simulations
In order to describe and understand the spread of an infectious disease, we need to set up a differential equation model to estimate the transmission rates and the blocking rates to symptomatic and asymptomatic infections. Assume that the process of the spread of an infectious disease are divided into m time intervals, representing differentprevention control measuresandtreatment efficacy, respectively. Over the lth time interval, the model has the form (also see [11, 13, 14]):
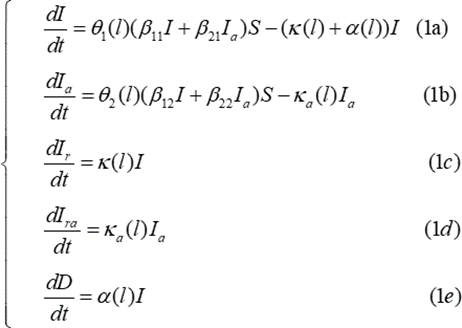
where 1(l)=(1-1(l)) and2(l)=(1-2(l)) (l= 1, 2,. . ., m) represent the blocking rates to symptomatic andasymptomatic infections, respectively. I and Ia represent the numbers of current symptomatic individuals and currentasymptomatic individuals charged in medicalobservations, respectively. Ir and Ira represent the numbers of current cumulative recovered symptomatic individuals and current cumulative asymptomatic individuals discharged from medical observations, respectively. D represents the number of current cumulative died symptomatic individuals. β12 and β22 represent the transmission rates of the symptomatic infections caused by symptomatic individuals and asymptomatic individuals, respectively. β12 and β22 represent the transmission rates of the asymptomatic infections caused by symptomatic individuals and the asymptomatic individuals, respectively. S represents susceptible population (can assume S = 1, see [11]). κ(l) and κa(l) represent the recovery rates of the symptomatic individuals and the asymptomatic individuals, respectively. α(l) represents the death rate of the symptomatic individuals.
For Shanghai sixth COVID-19 epidemic,it can be assumed that the transmissions are divided into 13- timeintervals (see solid points in Figs. 1 and 2). We need to determine the parameters of equation (1) forl = 1, 2, .. ., 13.Denote
t1 = 6, t2 = 10, t3 = 15, t4 = 20, t5 = 27,
t6 = 30, t7 = 37, t8 = 40, t9 = 47, t10 = 52,
t11 = 60, t12 = 67, t13 = 75.
[tl−1, tl] is the lth time interval. Denote Ic (tl) to be the number of the reported current symptomatic individuals, and Ica (tl)be the number of the reported currentasymptomatic individuals chargedin medical observations. Denote Icr (tl) to be the number of the reported currentcumulative recovered symptomatic individuals, and Icra (tl) be the number of the reported currentcumulative asymptomatic individuals discharged from medical observations. Dc(tl) be the number of the reported current cumulative died individuals. Using the minimization error square criterion:
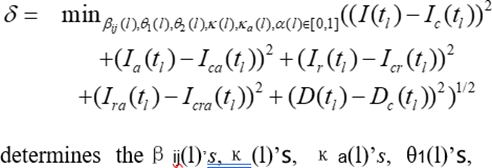
θ2(l)’s, and α(l)’s.The calculated parameters are shown in Table 1. The corresponding simulation results of equation (1) are shown in Fig. 1 and Fig.
- Observe that the simulation results of equation (1) were in good agreement with the data of the COVID-19 epidemics. At the end points (see solid dots in Figs. 1 and 2) of the 13 investigated time-interval [tl−1, tl] ′s, the simulated numbers and the actual reported numbers were approximate the same (errors were less than one, respectively. See the solid blue lines, the red lines, and the black line in Fig. 1 and Fig. 2).
Results and Discussions
The equation parameters of the recent mainland COVID-19 epidemics (RMCE) are shown in Table 2 (see reference [16] amended version of reference [13]). From Table 1, Table 2, Fig. 1, and Fig. 2, it follows
- The transmission rate β11 of the symptomatic infections caused by the symptomatic individuals was much lower than the first 75 day’s (December 31, 2021 ∼ March 16, 2022) average transmission rate β11 of RMCE (0.0350:0.1072), and was much lower than the last 75 day’s (March 1 ∼ May 15, 2022) average transmission rate β11 of RMCE (0.0350: 0.2602).
- The transmission rate β12 of theasymptomaticinfections caused by the symptomatic individuals was much higher than the first 75 days averagetransmission rate of RMCE (0.4890:0.0417), and was similar to the last
30 day’s (April 16∼ May 15) averagetransmission rate of RMCE(0.4890:0.5000).
- The transmission rate β21 of the symptomatic infections caused by the asymptomatic individuals was much lower than the first 75 day’s average transmission rate of the RMCE (0.0413:0.0637), and was still much lower thanthe last 30 day’s average transmission rate of RMCE (0.0413:0.1).
- The transmission rate β22 of theasymptomaticinfections caused by the asymptomatic individuals was much higher than the first 75 day’s corresponding average transmission rate of RMCE (0.4269:0.0128),
and was much higher than the last 30 day’s corresponding average transmission rate of RMCE (0.4269: 0.1000).
- The last 30 days’ average blocking rate of Θ1(l)′s to the symptomatic infections was lower than the last 30 days’ average blocking rate of RMCE (82.77%:93.83%).
- The last 30 days’ average blocking rate of Θ2(l)′s to the asymptomatic infections was much higher than the last 30 days’ average blocking rate ofRMCE (87.61%:65.83%).
- However, the first 30 days’ average blocking rate tothe asymptomatic infections was much lower thanthe first 30 days’ average blocking rate of RMCE (41.86%:53.88%).
- The average recovery rate(κ(l)′s) of the symptomatic individuals was much lower than the corresponding average recovery rate of the symptomatic individuals of RMCE (0.0512:0.0636).
- The last two weeks’ (May 1 May 15) average recovery rate (κ(l)′s) of the symptomatic individuals was similar to the one of the corresponding RMCE (0.1412:0.1323).
- The first 30 days’ averagerecovery rate (κa(l)′s) of the asymptomatic individuals was much lower than the first 30 days’ averagerecovery rate (κa(l)′s) of RMCE (0.01026:0.01996). The last 30 days’ average recovery rate (κa(l)′s) of the asymptomatic individuals was higher than the last 30 days’ averagerecovery rate of RMCE (0.10066:0.09149).
Virtual simulations
Assume that after day 75 (May 15, 2022), it still keeps the blocking rates Θ1(13) and Θ2(13), the recovery rates κ(13),ka(13), and the death rate α (13)until day 105 (June 14, 2022). The simulation results of equation
(1) are shown in Fig. 1 and Fig. 2 by cyan lines, magenta lines, dot blue line, respectively. Calculated results show that on day 105, the numbers of the current symptomatic and asymptomatic individuals reach about 409 individuals (see cyan solid dot in Fig. 1) and 2460 individuals (see magenta dot in Fig. 1), respectively. The numbers of the cumulative recovered symptomatic individuals and cumulative asymptomatic individuals discharged in medical observations reach about 57152 individuals (see cyan solid dot in Fig. 2), and 572084 individuals (see magenta dot in Fig. 2), respectively. The number of deaths symptomatic individuals reach about 619 individuals (see blue dot in Fig. 2).
Furthermore, assume that after day 75, it still keeps the recovery rates κ (11), κa (11), and the death rate α (11) but increases the blocking rates (Θ1(l), Θ2(l))
≡ (100%, 100%) until day 105. The simulation results of equation (1) are shown in Fig. 1 and Fig. 2 by green lines yellow lines, and dot red line, respectively. Calculated results show that on day 105, the numbers of the current symptomatic and the asymptomatic individuals reduce about 187 (see green solid dot in Fig. 1) and 1005 (see yellow solid dot in Fig. 1), respectively. The numbers of the cumulative recovered symptomatic individuals and cumulative asymptomatic individuals discharged from medical observations reach about 56002 (see green solid dot in Fig. 2) and 561897 (see yellow solid dot in Fig. 2), respectively. The number of death symptomatic individuals reduce to about 609.
Practically on day 105, the numbers of the current symptomatic and asymptomatic individuals, the cumulative recovered symptomatic individuals and asymptomatic individuals, and the death symptomatic individuals reach 137, 57009, 57729 and 588, respectively. It implies that during days 76 ∼ 105, the average blocking rates to the symptomatic and the asymptomatic infections reached 100%, and the average recovery rates of the current symptomatic individuals and the current asymptomatic individuals (even data are not available) increased significantly, the average death rate of the death individuals decreased significantly.
| l | Days | Dates | Θ1(l) | Θ2(l) | κ(l) | κa(l) | α(l) |
| 1 | 0-6 | 3.01-3.07 | 0% | 0% | 0 | 0.00288000 | 0 |
| 2 | 7-10 | 3.08-3.11 | 55.25% | 48.06% | 0 | 0.00090000 | 0 |
| 3 | 11-15 | 3.11-3.15 | 60.3% | 61.18% | 0 | 0.00220000 | 0 |
| 4 | 16-20 | 3.16-3.20 | 70 % | 44.953% | 0.025470 | 0.02445000 | 0 |
| 5 | 21-27 | 3.21-3.27 | 90.11% | 42.18741% | 0.067400 | 0.01851900 | 0 |
| 6 | 28-30 | 3.28-3.30 | 67.218% | 54.78091% | 0.025610 | 0.011209 | 0 |
| 7 | 31-37 | 3.31-4.07 | 85.797% | 56.1531% | 0.011920 | 0.0083930 | 0 |
| 8 | 38-40 | 4.08-4.10 | 84.775% | 64.6838% | 0.040690 | 0.0100525 | 0 |
| 9 | 41-47 | 4.11-4.17 | 74.642% | 78.45215% | 0.036238 | 0.0540004 | 0.0000330 |
| 10 | 48-52 | 4.18-4.22 | 75.807% | 85.3491 % | 0.06766 | 0.0952666 | 0.0003960 |
| 11 | 53-60 | 4.23-4.30 | 77.0718% | 88.20378% | 0.108624 | 0.09744147 | 0.0020400 |
| 12 | 61-67 | 5.01-5.07 | 93.989% | 92.07175% | 0.1804539 | 0.1346101 | 0.0012995 |
| 13 | 68-75 | 5.08-5.15 | 92.344% | 93.9226% | 0.101955 | 0.121974 | 0.0008990 |
Table 1: Equation parameters of the COVID-19 epidemic in Shanghai during2022.3.1- 2022.5.15. β11 = 0.035, β12
= 0.489, β21 = 0.0413, β22 = 0.4269.
| l | Days | β11(l) | β21(l) | β12(l) | β22(l) | Θ1(l) | Θ2(l) | κ(l) | κa(l) | α(l) |
| 1 | 0-4 | 0.049056 | 0.072052 | 0.002102 | 0.094068 | 0% | 0% | 0.017296 | 0.0310702 | 0 |
| 2 | 5-11 | 0.058990 | 0.072052 | 0.000100 | 0.000100 | 10.6% | 99% | 0.045215 | 0.0313170 | 0 |
| 3 | 12-20 | 0.056600 | 0.072052 | 0.002102 | 0.000094 | 25% | 99% | 0.053450 | 0.0003170 | 0 |
| 4 | 21-30 | 0.044400 | 0.072052 | 0.004100 | 0.003990 | 49.84% | 17.5% | 0.073030 | 0.0171500 | 0 |
| 5 | 31-43 | 0.077340 | 0.071000 | 0.002500 | 0.003 | 51.02% | 72.5% | 0.065000 | 0.05645 | 0 |
| 6 | 44-48 | 0.124800 | 0.071000 | 0.025000 | 0.003 | 51.15% | 71.6% | 0.059440 | 0.04670 | 0 |
| 7 | 49-55 | 0.124800 | 0.071000 | 0.020900 | 0.003 | 25.04% | 72.377% | 0.031460 | 0.03130 | 0 |
| 8 | 56-64 | 0.124900 | 0.017800 | 0.059000 | 0.003 | 31.98% | 70.29% | 0.031550 | 0.01290 | 0 |
| 9 | 65-70 | 0.125200 | 0.017800 | 0.141000 | 0.009 | 26.02% | 21.07% | 0.032950 | 0.00319 | 0 |
| 10 | 71-77 | 0.287270 | 0.1 | 0.160680 | 0.009 | 43.839% | 26.337% | 0.024098 | 0.004689 | 0.000027 |
| 11 | 78-82 | 0.287270 | 0.1 | 0.160680 | 0.009 | 73.264% | 37.524% | 0.028489 | 0.018943 | 0 |
| 12 | 83-90 | 0.287270 | 0.1 | 0.294230 | 0.009 | 87.602% | 39.037% | 0.039845 | 0.0183963 | 0 |
| 13 | 91-100 | 0.287200 | 0.1 | 0.500010 | 0.1 | 92.89% | 28.441% | 0.087194 | 0.0164510 | 0 |
| 14 | 101-107 | 0.287200 | 0.1 | 0.5 | 0.1 | 91.382% | 40.774% | 0.071904 | 0.0534810 | 0.000017 |
| 15 | 108-110 | 0.287200 | 0.1 | 0.500010 | 0.1 | 91.692% | 60.786% | 0.071146 | 0.0875565 | 0.000242 |
| 16 | 111-115 | 0.287270 | 0.1 | 0.5 | 0.1 | 93.337% | 56.636% | 0.092125 | 0.0809330 | 0.001099 |
| 17 | 116-120 | 0.287270 | 0.1 | 0.5 | 0.1 | 92.093% | 76.839% | 0.1199341 | 0.1000628 | 0.001758 |
| 18 | 121-127 | 0.287270 | 0.1 | 0.5 | 0.1 | 97.57% | 77.476% | 0.1650770 | 0.1232887 | 0.001060 |
| 19 | 128-135 | 0.287270 | 0.1 | 0.5 | 0.1 | 96.878% | 82.469% | 0.0995065 | 0.1036150 | 0.000668 |
Table2: Equation parameters of the COVID-19epidemics in mainlandChina during 2021.12.31- 2022.5.15 [16].
Concluding Remarks
The main contributions of this paper are summarized as follows:
- It is the first time to summary and analyzethe sixth Shanghai COVID-19 epidemic, and compare with
the recent mainland China COVID-19 epidemics (RMCE).
- It uses model (1) to simulate the dynamics of the sixthShanghai COVID-19 epidemic. The simulation results
were approximate the same as the reported practical data at the end pointsof the investigated time intervals.
- The first 30 day’s low blockingrates to the symptomatic infections, the low recoveryrates of the
symptomatic individuals, and the high transmission rate of the asymptomatic infections may be the reasons to cause the rapid spreadof the Shanghaiepidemic in the first two months.
- It is not wise strategyto withdraw all prevention and
control measures before no new COVID-19 infectedcases are reported. 100% blocking rate to COVID-19 infection spreadis key strategies for early clearance or reduction of epidemic spread [11–14].
- The administration should at least maintain the prevention and control measuresimplemented 7 days
after reaching the infection turning point of the numbers of the current hospitalized symptomatic individuals and the currentasymptomatic individuals chargedin medical observations until the society free of infected COVID-19 cases have been kept for 7 days.
Funding
The author has not declared a specific grant for this researchfrom any fundingagency in the public, commercial or not for profit sectors.
Conflict of Interest
The author declaresno potential conflictof interest.
Data availability statement
Data are availableon reasonable request.Please email the author (13501029489@163.com).
Ethical Statement
Not applicable/No human participants included.
References
- WHO, “Coronavirus 2019,” May 8, (2022), http://www.who.int/emergencies/diseases/novel- coronavirus-2019.
- Zhao S, Chen H, “Modeling the epidemic dynam- ics and control of COVID-19 outbreak in China,” Quant Bio, no. 11, pp. 1–9, (2020).
- Yang Z, Zeng Z, Wang K, Wong SS, Liang W, et al., “Modified SEIR and AI prediction of the epidemics trend of covid-19 in China under public health interventions,” J Thorac Dis, vol. 12, pp. 165–174, (2020).
- Zhao S, Linc Q, Ran J, Musa SS, Yang G, et al., “Preliminary estimation of the basic reproduc- tion number of novel coronavirus (2019-nCoV) in China, from 2019 to 2020: A data-driven analysis in the early phase of the outbreak,” Int J Infect Dis, vol. 92, pp. 214–217, (2020).
- Roosa K, Lee Y, Luo R, Kirpich A, Rothenberg R, et al., “Real-time forecasts of the COVID-19 epidemic in China from February 5th to February 24th, 2020,” Infect Dis Model, vol. 5, pp. 256–263, (2020).
- Tang B, Bragaazzi NL, Li Q, Tang S, Xiao Y, et al., “An updated estimation of the risk of trans- mission of the novel coronavirus (2019-nCov),” In- fect Dis Model, vol. 5, pp. 248–255, (2020).
- Li X, Li Z, “Study on transmission model of the novel coronavirus (in Chinese),” (2020),
- Chintalapudia N, Battinenia G, Sagaroa GG, Amenta F, “COVID-19 outbreak reproduction number estimations and forecasting in Marche, Italy,” Int J Infect Dis, vol. 96, pp. 327–333, (2020).
- Chang SL, Harding N, Zachreson C, Cliff OM, Prokopenko M, “Modelling transmission and con- trol of the COVID-19 pandemic in australia,” Nat Commun, vol. 11, pp. 1–13, (2020).
- Niu R Chan YC Wong EW Van Wyk MA, Chen G, “A stochastic SEIHR model for COVID- 19 data fluctuations,” Nonlinear Dyn., vol. 106, (2021).
- L. Min, “Modelling, Simulations and Analysis of the First and Second COVID-19 Epidemic in Bei- jing,” November 15, 2021, medRxiv preprint doi: https://doi.org/10.1101/2021.07.04.21259205.
- “Summaries, Analysis and Simula- tions of COVID-19 Epidemic in Shang- hai,” May 16, 2022., medRxiv preprint doi: https://doi.org/10.1101/2022.05.15.22273842.
- “Summaries, Analysis and Simulations of Recent COVID-19 Epidemic in Mainland China,” May 2, 2022., medRxiv preprint doi: https://doi.org/10.1101/2022.04.03.22273225.
- Min L, “Summaries, analysis and simulations of covid-19 epidemics in shanghai,” J Infect Dis Ther, vol. 10, no. S1, p. 005, (2022).
- Health Commision of Shanghai, “Epidemic bulletin (in Chinese),” 2020.1.20-2022.6.14, https://wsjkw.sh.gov.cn/.
- L. Min, “Summaries, Analysis and Simulations of Recent COVID-19 Epidemic in Mainland China,” J Infect Dis Ther, vol. 10, no. 4, p. 505.