Archive : Article / Volume 2, Issue 1
Case Report | DOI: https://doi.org/10.58489/2836-3582/004
Comparative study of hematopoietic reconstitution in patients of the Arnaldo Milian Hospital from Santa Clara
- PhD in Technical Sciences. Professor. Department of Mathematics. Faculty of Mathematics, Physics and Computer Science, Central University "Marta Abreu" of Las Villas, Villa Clara, Cuba. https://orcid.org/0000-0002-6331-6569
- First Degree Specialist in Hematology and General Comprehensive Medicine. Assistant Professor and Associate Researcher. Arnaldo Milián Hospital, Villa Clara, Cuba. https://orcid.org/0000-0001-8020-9186
- Graduate in Mathematics. University graduate in training. https://orcid.org/0000-0002-6121-0883
- Graduate in Mathematics. https://orcid.org/0000-0003-4612-5071
- PhD in Mathematical Sciences, Professor, Department of Physics. Faculty of Mathematics, Physics and Computer Science, Universidad Central "Marta Abreu" de Las Villas, Villa Clara, Cuba. https://orcid.org/0000-0001-9181-3282
- First Degree Specialist in Hematology and General Comprehensive Medicine. Instructor Professor at Arnaldo Milián Hospital, Villa Clara, Cuba. https://orcid.org/0000-0002-6382-1338
- First Degree Specialist in Hematology Instructor Professor at Arnaldo Milián Hospital, Villa Clara, Cuba. https://orcid.org/0000-0002-9209-8863
Correspondng Author: Miguel Ãngel MartÃnez
Citation: M.Ã. MartÃnez, A.L. Sacerio, D.L. Obregón, D.D. EnrÃquez, Carlos de la C.R.F., Bárbaro A.M.R., Jorge Félix G.R., (2023). Comparative study of hematopoietic reconstitution in patients of the Arnaldo Milian Hospital from Santa Clara. Journal of Hematology and Disorders. 1(1). 10.58489/2836-3582/004
Copyright: © 2023 Miguel Ãngel MartÃnez, this is an open access article distributed under the Creative Commons Attribution License, which permits unrestricted use, distribution, and reproduction in any medium, provided the original work is properly cited.
Received Date: 2023-01-10, Received Date: 2023-01-10, Published Date: 2023-01-21
Abstract Keywords: hematopoiesis, stem cell transplant, cell differentiation.
Abstract
A mathematical model was applied to the hematopoietic reconstitution study of a group of thirteen patients with Hodgkin and Non-Hodgkin Lymphoma after having undergone Autologous Transplantation of Hematopoietic Progenitors in the Hematology Service of the Surgical Clinical University Hospital "Arnaldo Malian". Based on the model, the recovery process dynamics were computationally simulated, and the hematopoietic recovery times of each patient collected in the clinical data were compared with the times predicted by the simulations. Despite the simplicity of the mathematical model, it is surprising how well the reconstitution curves coincide with the clinical data collected, in such a manner that the model is able to predict with acceptable accuracy when hematopoietic recovery occurs. Model forecasts can be used to estimate the average duration of the pre-implant period, in which severe aplasia and immunodeficiency condition the occurrence of hemorrhagic and infectious complications that are often severe. In addition, it is an important tool for planning next patient´s transplant by the team, thereby reducing the time spent in planning the logistics required between one transplant and the next, which, in turn, will increase the number of patients benefited by this procedure.
Introduction
Hematopoietic progenitor cell transplantation (HSCT) is a procedure that allows the cure of benign and malignant hematological diseases. This effectiveness is confirmed by the gradual increase in the number of procedures performed worldwide and reported in the various registries (American, European, international, etc.). The International Center for Bone Marrow Transplant Research (CIBMTR) reported in 2018 a total of 504 106 transplanted patients, the pathologies with indications were, in order of frequency: lymphomas, plasma cell disorders and acute myeloid leukemias [1].
Transplants can be autologous, or from a histocompatible allogeneic donor. They are part of the treatment process and are part of the procedure algorithms for certain types of leukemias, lymphomas, myelomas and other less common diseases. Indications for HSCT include hematological malignancies (acute and chronic leukemias, lymphomas, myeloma), acquired non-malignant bone marrow disorders (bone marrow aplasia), and genetic diseases associated with disorders of hematopoietic function (thalassemia, sickle cell disease, severe combined immunodeficiencies). HPT is also used in the support of patients undergoing high doses of chemo-radiotherapy for the treatment of malignant tumors and in whom hematologic toxicity limits drug administration, as well as in a group of autoimmune diseases. There is increasing knowledge about hematopoietic stem cells, peripheral blood has replaced bone marrow as a source of progenitors in most pathologies, umbilical cord blood has established itself as a viable source of progenitors, and umbilical cord blood has become a viable source of progenitors [2].
Due to the growing interest in stem cell applications, such as stem cell-based therapies for organ-affected, degenerative diseases, reconstitution of blood structure after chemotherapy in the treatment of leukemias, etc., a wide spectrum of methods has been developed to broaden the knowledge about the rules of this process [3,4]. Several mathematical and numerical models have been developed to aid in the understanding of stem cell differentiation [5-10]. The above models present different mathematical approaches to describe the processes of differentiation and self-renewal involving stem cell proliferation and the mechanisms of differentiation at each stage. All these models describe different parts of the homeostasis process in adult tissue, representing a first deterministic approach to mathematically understand these complex dynamics.
Another important aspect in mathematical modeling is to incorporate those environmental and external perturbations to the system, which in the previous models are not considered, but which influence the maturation and self-renewal process of the stem cells. This gives rise to consider stochastic models that, as a fundamental characteristic, consider the environmental perturbations of the system, which are expressed mathematically by means of diffusion coefficients and are known as random or stochastic noise. This new factor considered has a direct reflection in the modeling and representation of the cell maturation process. The development and study of this type of models expresses the existing interest in deepening the knowledge in the applications that the area of stochastic processes has in biology, and fundamentally, in the area of medicine. This will be revealed in a future work.
This work intends to show the usefulness of a deterministic model, based on ordinary differential equations, for the computational simulation of the hematopoietic reconstitution process. Starting from a real clinical data referred to 13 patients treated at the Surgical Clinical University HospitalArnaldo Milián from Santa Clara, Villa Clara province, affected by Hodgkin's Lymphoma (HL) and non-Hodgkin's Lymphoma (NHL), submitted to autologous transplant with hematopoietic progenitors´ obtention from stimulated bone marrow and myeloablative conditioning regimen (Carboplatin + Cyclophosphamide + VP-16), the process of hematopoietic reconstitution is mathematically simulated, the equations are calibrated considering three different sets of parameters, and the simulation results are compared with the results recorded in the clinical data. It is also the aim of the work to provide information on how different cellular properties influence hematopoietic recovery after stem cell transplantation. In particular, the role of cell division asymmetry is being investigated motivated by recent experimental observations. We also intend to discuss with the community of specialists the feasibility of the assumed hypotheses with a view to possible modifications, and thus new models, and, above all, to properly interpret the biological consequences implied by the mathematical results.
Methods
The deterministic model:
It is a particularization of the model presented by the team led by Anna Marciniak- Czchora [11]. It is based on the traditional assumption that in each blood precursor cell lineage there is a discrete chain of maturation stages that are sequentially traversed, see figure 1, taken from reference [9].
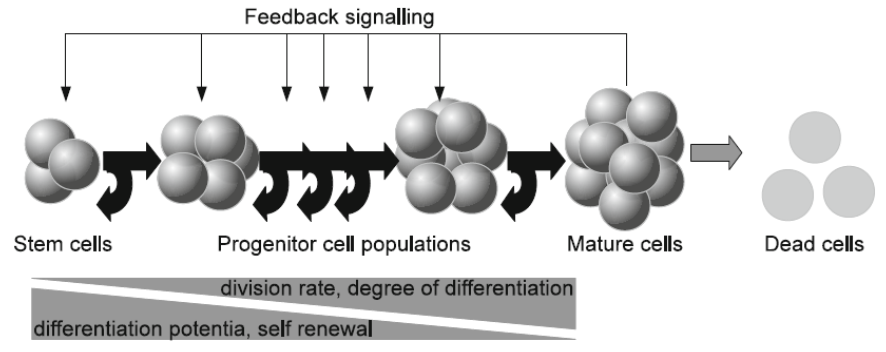
Cell behavior is characterized by a proliferation activity, a probability to differentiate and a probability to die. Cell properties are assumed to change during the maturation process. The model is restricted to one mature cell type and the regulation of differentiation of different lineages is assumed to be independent of each other. As a next simplification it is assumed that the cell system under consideration is regulated by a single cytosine. The reasoning leads to the following assumptions: () Only one type of mature cells is taken into account.
() In order to mature, cells have to pass a discrete number of successive maturation steps. None of these stages can be suppressed. The passage of cells through these stages is in one direction, from primitive to more mature stages. The transition in the opposite direction is bypassed.
() Cell behavior is regulated by feedback signals. Only one type of signal is taken into account.
() The behavior of cells at maturation stage I at instant t depends only on the signal at instant t and on the number of maturing cells at this stage I.
() The concentration of signaling molecules depends on the density of mature cells. If the density of mature cells is low, the concentration of signaling molecules is high.
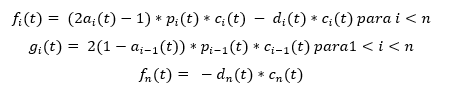
Based on the above hypotheses, the time evolution of this cellular system is described by the following system of ordinary differential equations
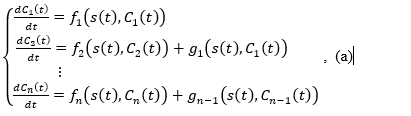
where:
is the density (number of cells per kilogram of body weight) of the stem cell population at time , denotes the population density of cells of type i at time instant , is the population density of mature cells at instant , denotes the flux of cells from maturation stage i to maturation stage i+1 due to differentiation (which is non-negative based on )), denotes the change of which is caused by the maturation processes at the stage i ,is the regulatory signal (concentration of signaling molecules), which depends only on the concentration of mature cells The terms of the left-hand members of the equations express the change rates of each of the populations. A complete mathematical study of this model and the biological implications are described in reference (4).
A special version of the model:
It is based on the assumption that the differentiation process is strictly related to cell division, i.e., that differentiation takes place only during cell division, therefore, the rate of cell differentiation is proportional to the rate of proliferation.
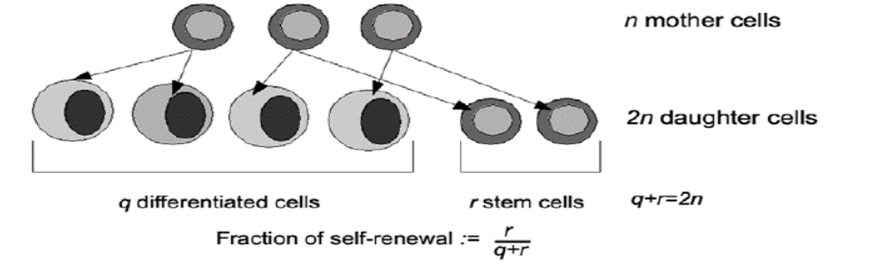
To quantitatively describe self-renewal, the self-renewal fraction is introduced, , which describes what fraction of progeny cells is identical to the progenitor cells (this parameter can be interpreted as the probability that the daughter cell has the same properties as the mother cell). See figure 2 taken from reference (4). Then:
Where is the proliferation rate of the subpopulation of type i at time t, is the cup of death and is the self-renewal fraction.
The feedback signal is assumed to be dependent on the concentration of mature cells and is given by the rational function
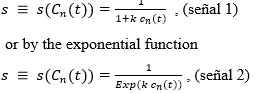
where is a certain positive constant selected from clinical experimentation.
These simple models for the signal reflect the assumption that the signal reaches its maximum in the complete absence of mature cells and then decreases asymptotically to zero when the level of mature cells increases. For the numerical simulations, two different values of k were chosen, following the literature consulted, namely, k1 =1.28 X 10 -9 y k2 = 1.6 × 10⁻¹⁰
Considering different regulatory feedback mechanisms leads to different types of nonlinearities in the model equations. In particular, three different regulatory mechanisms have been studied [10], namely:
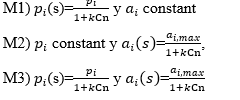
The first mechanism describes the scenario in which increasing the density of signaling molecules affects the rate of proliferation. The replication rate increases when the level of mature cells decreases, leading to stabilization of cell number at some value (equilibrium point).
The second mechanism is based on the hypothesis that signaling molecules secreted during aplasia influence the relationship between the rate of self-renewal versus the rate of differentiation. High values of the feedback signal enhance self-renewal, whereas low values enhance differentiation and thus cells in the posterior compartment. Here, a single positive steady state exists only if the self-renewal rate of the first compartment is strictly higher than the self-renewal rates for the other compartments. Therefore, the proportion of progeny cells contributing to the amplification of the stem cell compartment must be higher than at any other stage.
It seems justifiable to consider a mechanism in which the feedback signal regulates both parameters simultaneously. This is the case of the third regulatory mode. Qualitatively, the behavior of this mechanism is similar to the behavior of mechanism 2.
In reference (4) it was shown that regulation of hematopoiesis output is more efficient and can be achieved on the clinically relevant time scale only if the regulatory parameters maintain the proportions of cells that do not differentiate at the next division. Regulation of proliferation rates (pi parameters) is not sufficient for this purpose which corresponds to the regulatory mode M1).
For this reason, the numerical simulations we will consider hereafter will be for the regulatory mode M2). Consideration of the regulatory mode M3) leads to qualitatively similar results. Therefore, in the remainder of this paper we assume that the proliferation rates are constant over time and the fraction of self-renewal is controlled by the feedback signal, where is the maximum fraction of self-renewal. In addition, mortality rates are assumed to be constant over time.
The clinical data:
Clinical data concerning hematopoietic reconstitution after HSCT were collected from the review of hemato grams in the medical records of thirteen patients with HL and NHL at the Hematology Service of the Surgical Clinical University HospitalArnaldo Malian using myeloablative chemotherapy of Carboplatin (400 mg x m2 body surface area ) + Cyclophosphamide (60 mg x Kg ) + VP- 16 (15 mg x Kg) on days -2 and -1 followed by autografting of a stimulated bone marrow hematopoietic progenitor hematopoietic progenitor transplant (mean mononuclear cells/kg body weight) on day 0. The obtention was performed in the operating room immediately prior to initiating conditioning treatment (never earlier than one month after the last chemotherapy). Patients under spinal anesthesia were placed in prone position with slight elevation of the posterior iliac crests. Using Jamshidi puncture needles, multiple aspirative punctures were performed at the level of the posterior iliac crests directing the trocar in different directions until 15 ml x kg were extracted from the recipient. The harvested marrow was kept in the blood bank at a temperature of 4oC until the day of infusion. The mobilization regimen was carried out with Heber vital granulocyte colony stimulating factor (Filgrastim) subcutaneously at a dose of 10 μ/kg every 12 hours daily for 5 days (day -7 to -3(4)
Results
For the TPH simulation we chose, as in reference (11), 8 compartments, corresponding to the following stages of maturation of hematopoiesis: HSC, LTC-IC, CFU-GM, CFU-G, Myeloblast, Promyelocyte, Myelocyte, Granulocyte Neutrophil. We focused on neutrophils, as they make up the majority of leukocytes (about 50-75%). The values of the parameters proliferation rates and mortality rates, as well as the initial conditions have been assumed based on the referenced literature. The self-renewal fractions and the k coefficient, which cannot be measured, were estimated in such way that the steady-state cell counts are in agreement with literature. We assume that self-renewal decreases from the most primitive cells to the most specialized cell types and that stem cells divide two magnitude ordersslower than progenitors. In two of the selected parameter sets, see Table 1, proliferation increases strictly monotonically increasing with maturation. These assumptions are in agreement with the classical understanding of stem cell systems.
We solve the system of differential equations (a) that models the reconstitution process with three different sets of parameters to investigate the influence of interindividual differences in reconstitution kinetics, see Table 1.
Table 1: Proliferation rates (pi) and self-renewal fractions (ai) used in the simulations for each compartment.
Set 1 | |||||||
pi | 0.006 | 0.03 | 0.15 | 0.60 | 0.65 | 1.0 | 1.5 |
ai | 0.7350 | 0.7298 | 0.7245 | 0.7140 | 0.5775 | 0.4225 | 0.3675 |
Set 2 | |||||||
pi | 0.006 | 0.03 | 0.15 | 0.60 | 0.65 | 1.0 | 1.5 |
ai | 0.77 | 0.7645 | 0.7590 | 0.7590 | 0.55 | 0.44 | 0.33 |
Set 3 | |||||||
pi | 0.0057 | 0.0297 | 0.03 | 0.42 | 0.48 | 1.05 | 1.5 |
ai | 0.7 | 0.6990 | 0.6690 | 0.6980 | 0.5 | 0.5 | 0.55 |
For the initial conditions of the system, we assume that 0.1% of the transplanted cells are stem cells. The ratio of HSC: LTC-IC is assumed to be 1:10, the ratios LTC-IC: CFU-GM and CFU-GM: CFU: CFU: G are assumed to be 1:3. We further assume that the transplant contains negligible amounts of Myeloblasts, Promyelocytes and Myelocytes.
Using specialized computer programs, the particular case of the system of differential equations (a) corresponding to the process of asymmetric cell division of hematopoietic stem cells is solved by numerical methods for the regulatory mode M2 for two different types of feedback signals. For each patient twelve simulations were performed, six taking the three sets of parameters, regulatory mode M2), signal 1, but varying the value of the constant k, namely, y k2= 1.6 X 10⁻¹⁰ and another six taking the regulatory mode M2) but the regulatory signal in exponential form. It has already been explained why only the M2 regulatory mode has been used). The simulation is also performed with a hypothetical patient defined by taking the mean body weight of the group of patients and a count of mononuclear cells according to their body weight in order to illustrate the behavior of an average patient of the group, see Table 2.
Table 2: Numerical experimentation with two feedback signals (signal 1 and signal 2)
Patient | CMN (X 108 ) | Weight( Kg) | Hematopoietic Recovery (days) | Simulation.Signal1 (days) | Simulation.Signal2 (days) |
1 | 2.99 | 92 | 18 | 11 | 9 |
2 | 0.21 | 75 | 17 | 17 | 17 |
3 | 3.8 | 106 | 13 | 9 | 9 |
4 | 1.5 | 58 | 10 | 11 | 11 |
5 | 1.62 | 90 | 10 | 11 | 11 |
6 | 1.62 | 59 | 11 | 11 | 11 |
7 | 1.47 | 100 | 11 | 11 | 11 |
8 | 0.97 | 100 | 15 | 13 | 12 |
9 | 1.8 | 77 | 18 | 11 | 10 |
10 | 1.8 | 76 | 14 | 11 | 11 |
11 | 2.3 | 76.5 | 11 | 10 | 10 |
12 | 2.76 | 90 | 15 | 10 | 10 |
13 | 1.59 | 80 | 8 | 11 | 11 |
14 | 2.92 | 73.5 | 17 | 10 | 10 |
15 | 2.6 | 98 | 11 | 10 | 10 |
16 | 1.8 | 63 | 11 | 11 | 11 |
Promedio | 1.77 | 82.13 | 11 | 11 |
The simulations showed very similar results with both signals, signal 1 corresponding to a rational function and signal 2 corresponding to an exponential function, for the three sets of parameters and the best results are obtained by selecting as coefficient in the signal the parameter k2. Table 2 shows the results of the simulations for each patient with both signals taking the second set of parameters. The fourth column shows the reported hematopoietic recovery and the fifth and sixth columns, the recovery predicted by the model. The difference between the reported hematopoietic recovery and that predicted by the model is 7 days in the worst case (patients 1 and 9), but in the rest it is ± 3 days, even coinciding, exactly, in several cases. It should be taken into account that the counts performed by the laboratory are not daily and recovery is reported the first time the recovery criterion is exceeded, so an error can also be introduced here. Considering the simplicity of the model and the possible perturbations that occur in the collection and measurement of the data the results of the simulations are significant. A value greater than or equal to 0.5 X 10⁹ neutrophilic granulocytes per liter of blood was taken as the hematopoietic recovery criterion.
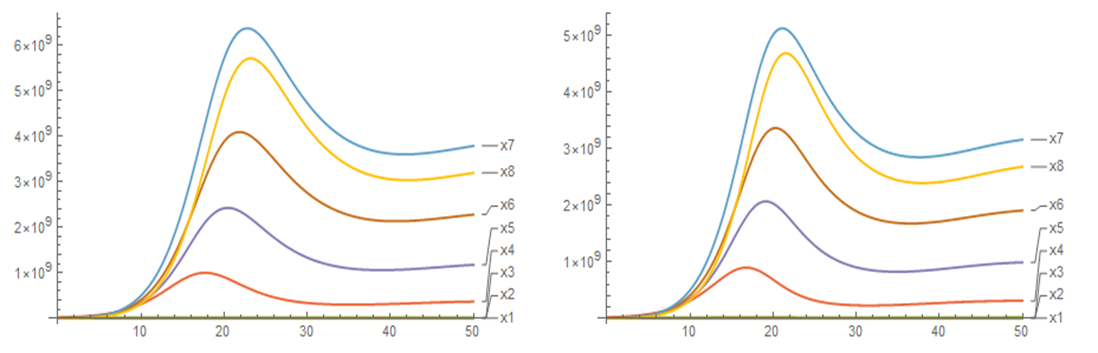
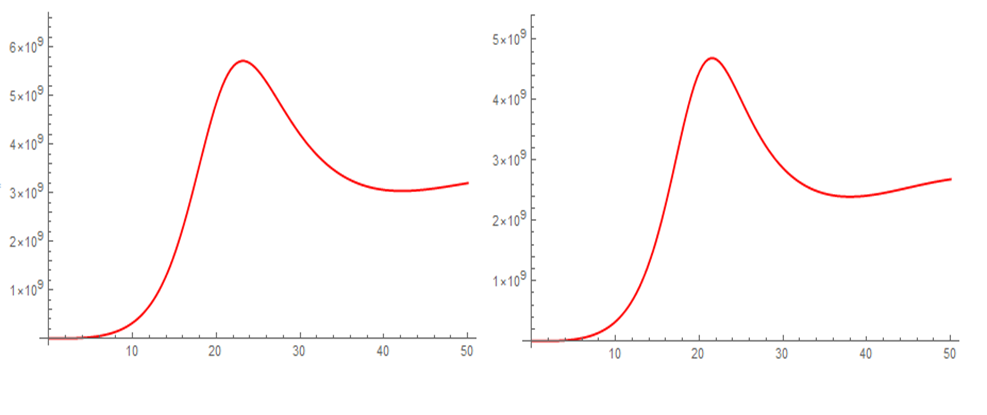
Figures 3 and 4 show the evolution over time of the population densities of the different compartments after transplantation for an average patient weighing 82.13 kg, Figure 3 for all cell populations and Figure 4 only for the last compartment or maturation stage. After the hematopoietic recovery criterion is satisfied, an increase in the neutrophil granulocyte count continues until it reaches a maximum near 5.7 X 10⁹/L, then declines to stabilize in the vicinity of 3.0 X 10⁹/L, which is in correspondence with what is observed in the clinic. The other compartments have similar behaviors, increasing, reaching a maximum, decreasing and stabilizing. Both the stability of the cellular dynamics and the range of values of the respective population densities can be appreciated. In general, there is little difference in the use of one or the other signal, but considering small differences in time, the exponential signal is more effective and related to the transplantation process.
Discussion
First of all, we would like to emphasize that the results of our numerical simulations fully coincide with the results reported in the referenced articles for other clinical data. It means that the mathematical methods used by us guarantee a level of accuracy and reliability similar to that used by other researchers in the field. It allows us to perform different simulations for this process or others of interest at no additional cost and to compare the results with the clinical data collected. We could also adjust the models to cases of interest by studying the consequences of suppressing or adding certain hypotheses.
Simulations show that the model is able to cover the observed range of reconstitution patterns by slight variation of the model parameters. As the simulated blood leukocyte counts are in reasonable agreement with reality, the model can be used to investigate the dependence of the time required for recovery on transplant size as already done in reference [11].
We have been able to verify what was stated there, namely that the proposed model can be applied to large groups of patients. To account for interindividual variability the self-renewal fractions can be chosen at random between 0 and 1 with the additional assumptions a1> 0. 5 y a1>ai para todo i> 1. The latter conditions are necessary for the existence of a constant steady state [4].
Mathematical modeling also has application to comparative studies of hematopoietic recovery according to CD34 count and intensity of conditioning regimens. The patient data in this article received myeloablative regimens; those with reduced toxicity or reduced intensity should logically have shorter periods of aplasia.
The proposed models contain different simplifications, such as restriction to one cell lineage, exclusive reliance on feedback from mature cells, and incorporation of a single feedback signal. These simplifications were adjusted based on clinical data. The main problem with clinical applications is the lack of knowledge of in vivo model parameters and exact regulatory modes. The crosstalk between different cytokines appears to be very complex and are not yet well understood from a biological point of view [12]. In addition, the model does not include immune reactions after allogeneic transplantation for which the underlying processes are not well defined. Our approach focuses on modeling the impact of cellular properties on measurable clinical outcomes. The models are able to provide information on which parameters are important to obtain rapid clinical recovery. Therefore, it may be useful for the optimization of transplantation strategies in areas where clinical experiments cannot be performed for ethical reasons. Furthermore, since the model covers the behavior of large groups of patients, it allows in silico clinical trials to be performed and enables better comparison of simulation results with clinical data.
Conclusions
The prognoses of the model can be used to estimate the average duration of the pre-implantation period, in which severe aplasia and immunodeficiency condition the occurrence of hemorrhagic and infectious complications, often severe, as well as the influence that different variables such as mononuclear cell count, CD 34, associated infections, among others, have on hematopoietic reconstitution. The aforementioned will allow the development of strategies in cases with delayed hematopoietic reconstitution to reduce the negative effects of prolonged periods of aplasia. Modeling is an important tool for planning the next patient to be transplanted by the team, by reducing the time spent in planning the logistics required between transplants, which will increase the number of patients benefiting from this procedure. In addition, the simulation can be applied to comparative clinical studies of different types of transplants depending on the source of progenitor cell procurement, type of donor, as well as the intensity of the conditioning regimens used.
Despite the simplicity of the mathematical model, it is surprising how well the reconstitution curves matched the clinical data collected, so that the model is able to predict with acceptable accuracy when hematopoietic recovery occurs.
Authorship contribution:
Miguel Angel Martínez Hernández: Provided the mathematical models. Performed the computational simulations. Contributed to the complete writing of the article.
Agnerys López Sacerio: Contributed to the complete writing of the article.
Bárbaro Andrés Medina Rodríguez: Collected the clinical data. He contributed in the discussion of the results.
Jorge Félix Guerra Rodríguez: Collected the clinical data. He contributed to the discussion of the results.
Dennis Lumpuy Obregón: Performed the computational simulations. He contributed to the review and discussion of the results.
Carlos de la Caridad Rodríguez Fadragas: Contributed to the review and discussion of the results.
Daylenis Dorta Enríquez: Contributed to the review and discussion of the results.
References
- CIBMTR Anual Report2018. Available from: http://cibmtr.org.
- S CF. Repositorio Unican. Repositorio Unican [Internet]. 2016. Available from: https://repositorio.unican.es/xmlui/bitstream/handle/10902/8919/Crespo%20Fernandez%20S..pdf?sequence=1.
- Gratwohl HB. Trends of hematopoietic stem cell transplantation in the third millennium. Curr Opin Hematol 16. 2009:420–6.
- Marciniak-Czochra TS. Mathematical models of hematopoietic reconstruction after stem cell transplantation. Model Based Parameter Estimation: Theory and Applications: Springer Verlag.
- Anna Marciniak-Czochra TS. Mathematical Models of Hematopoietic Reconstitution After stem Cell Transplantation. Model Based Parameter Estimation Theory and Aplication. Berlin: Springer; 2013. p. 191-206.
- W W, A.D H. The beauty of asymmetric divisions and self-renewal in the hematopoyetic system. Curr Opin Hematol. 2007:330-6.
- J. E. Till EAM, L. Siminovitch. A stochastic model of stem cell proliferation, based on the growth of spleen colony-forming cells: Proc Natl Acad Sci U S A; 1964.
- Mackey CCaM. A mathematical model of hematopoiesis--I. periodic chronic myelogenous leukemia. J Theor Biol. 2005:117–32.
- T. Stiehl AM-C. Characterization of stem cells using mathematical models of multistage cell lineages. Mathematical and Computer Modelling. 2010.
- Z. Wu KL-P, A. Bugde, L. A. Molyneux, B. Denard, W. Li,. Capacity for stochastic self-renewal and differentiation in mammalian spermatogonial stem cells. JCB vol 187.513-24.
- Lasota MM, M. Wazewska-Czyzewska. Minimizing therapeutically induced anemia. J Math Biol. 1981;13:149–58.
- Roeder I, de Haan G, Engel C, Nijhof W, Dontje B, Loeffter M. Interactions of erythropoitin, granulocyte colony-stimulating factor, stem cell factor and interleukin-11 on murine hematopoiesis during simultaneous. Blood. 1998:3222-9.