Archive : Article / Volume 1, Issue 1
Case Report | DOI: https://doi.org/10.58489/2837-3367/002
Detection of Thrombocytopenia, Anemia and Leukocytosis by Using Ensemble Learning
- Arel University, Faculty of Engineering and Architecture, Department of Computer Engineering, Turkey.
- Arel University, Medicine Faculty, Department of Medical Biology, Turkey.
Correspondng Author: Duygu KIRKIK
Citation: Pinar KARADAYI ATAS, Duygu KIRKIK, (2022). Detection of Thrombocytopenia, Anemia and Leukocytosis by Using Ensemble Learning. Journal of ENT and Healthcare. 1(1). DOI: 10.58489/2837-3367/002
Copyright: © 2022 Duygu KIRKIK, this is an open access article distributed under the Creative Commons Attribution License, which permits unrestricted use, distribution, and reproduction in any medium, provided the original work is properly cited.
Received Date: 2022-11-05, Received Date: 2022-11-05, Published Date: 2022-12-20
Abstract Keywords: Structural and functional data, machine learning, ensemble learning, Thrombocytopenia, Anemia and Leukocytosis
Abstract
Blood disorders are conditions that impact the bloodâs ability to function correctly. There is a range of different symptoms depending on the type. There are several different types of blood disorders such as Leukemia, chronic myelocytic leukemia, lymphoma, myelofibrosis, polycythemia, Thrombocytopenia, anemia and Leukocytosis. Some resolve completely with therapy, or do not cause symptoms and do not affect overall lifespan Some are chronic and lifelong but do not affect how long you live. Other blood disorders, like sickle cell disease and blood cancers, can be fatal. Thereneeds to capture of hidden information in the medical data for detecting diseases in the early stage. In this study, we apply the Ensemble Learning technique for classification. We compared our result with other classification methods. The results show that Ensemble Learning methods can predict the Tumor of blood disease better than the other classifiers..
Introduction
Global healthcare systems face a basic issue in providing accessible and accurate diagnosis (Singh et al., 2014). An estimated 5% of outpatients in the US alone are given the incorrect diagnosis each year. Since one in three misdiagnoses of patients with major medical illnesses results in serious patient harm, it is estimated that 20% of patients with serious medical disorders receive incorrect diagnoses at the primary care level(Graber, 2013).
In a diagnostic procedure, further data collection from the patient's medical history, a physical examination, and different diagnostic procedures, including clinical laboratory testing, is done to supplement the information already accessible. Laboratory tests are employed to confirm, rule out, categorize, or monitor disorders as well as to direct medical care (Badrick, 2021). However, clinical laboratories often publish test findings as individual numerical or categorical values, and physicians typically focus primarily on those values that fall outside of a given reference range, so the full power of laboratory test results is frequently underestimated.
Machine learning algorithms have been designed and used to analyze medical datasets for many years (Tomašev et al, 2014). It offers several indispensable tools for intelligent data analysis with machine learning methods. Today, in many modern hospitals, data is collected with patient monitoring and other data collection devices and stored and shared in large information systems. Machine learning technology is currently very suitable for analyzing medical data and diagnosing diseases. Analysis of clinical data shows us how the biological mechanisms underlying diseases work and how risk factors influence their development. Data on accurate diagnoses are available in the form of medical records in hospitals or their departments. In medical machine learning studies, patient records with correct diagnosis are entered into a computer program and a learning algorithm is run. The resulting learning algorithm can then be used to improve diagnostic speed, accuracy, and/or reliability, and to assist the physician in diagnosing new patients, or to train non-specialists to diagnose patients with a specific diagnostic problem (Shehab et al,2022). The application of ML can help improve the dependability, effectiveness, and accuracy of systems for identifying particular diseases.
Clinical diagnosis of hematological disorders is mostly based on laboratory blood testing, yet even the most experienced hematologist may ignore trends, outliers, or connections among the countless blood parameters that contemporary laboratories are now measuring. Contrarily, machine learning algorithms are able to manage hundreds of attributes (parameters) and are able to recognize and make use of the interactions between these many attributes, making this field of medicine particularly interesting for machine learning applications.
Machine learning can be beneficial in several activities, such as narrowing a differential diagnosis, assisting therapy selection, providing risk forecasts, minimizing medical errors and enhancing efficiency. Predictive modeling, diagnostics, and image analysis are the three primary application areas in haematology that are steadily growing. A model for the prediction of 100-day mortality following allogeneic HSCT was created and both internally and externally verified by (Shouval et al., 2017) in a registry study from the European Society of Blood and Marrow Transplantation that included 28236 individuals with acute leukemia. The creation of the model utilized an interpretable boosted decision tree model that outperformed the prior benchmark for outcome prediction. Similar methods were employed by (Arai et al. ,2019) to forecast acute graft-versus-host disease (GVHD). Other teams have concentrated on developing methods that can forecast treatment response based on imaging and gene expression data (Gal et al., 2019). There are already artificial intelligence decision-support solutions for oncology. Based on age, serial chemistry, and complete blood count laboratory values, a model created by (Guncar et al., 2018) produces a list of likely diagnoses that are then entered into a support vector machine model. The aforementioned discoveries point to a number of potential real-world applications for AI. The results of pathology frequently play a significant role in guiding the treatment of malignancy, but there may be significant heterogeneity among observers, which can be especially true in the case of rare diseases and has important clinical implications (Elmore et al., 2015) AI models could act as a reliable reference standard in certain situations, supporting diagnoses or triggering a second person's review.
While still in its infancy, machine learning has similar potential for the practice of hematology as well as for medicine more generally. This review describes relevant AI ideas for individuals who are unfamiliar with them, applications where AI is useful in hematology, and upcoming difficulties with the integration of AI into clinical practice.
IBM Watson for Oncology combines patient and illness characteristics, published literature, available clinical trials, and top oncologists' experience to suggest and rank treatment alternatives. It does this using machine learning algorithms and natural language processing of the EMR (Malin, 2013). AI has been applied in a number of ways to increase the accuracy, practicality, or effectiveness of diagnoses. Based solely on mass spectrometry data from peripheral blood, CNN-based methods have been shown to accurately identify multiple myeloma (Deulofeu et al., 2019).
Our hypothesis was that if a machine learning-based predictive model were trained on a sufficiently large dataset of medical cases that included clinical laboratory blood tests, a specific haematological disease which are Thrombocytopenia, anemia and leukocytosis identified in the values of blood test results would be sufficient for the model to suggest a plausible diagnosis.
Material and method
Dataset
The 4000 samples are split between 1451 samples for adults with hematology, 1232 samples for children, and 1232 samples for tumors. We dropped this for the person's privacy. several characteristics, including the name and ID. The data set includes. an element called Clinic Number that represents the target label of the sample. The number 59 on its three labels indicates 80 refers to Hematology Adults, 95 refers to Hematology Children. different tumor types. We list the features of our dataset.depending on (National Heart Lung Blood Institute site, 2016)
Methods
RandomForestClassifier
The random forest classifier is made up of several different tree classifiers, each of which is created using a random vector sampled separately from the input vector. Each tree then casts one unit of vote for the most prevalent class to categorize an input vector. The randomly chosen features or a mix of characteristics are employed at each node of the random forest classifier in this study to build a tree. For each feature/feature combination chosen, bagging, a technique to create a training dataset by randomly drawing with replacement N samples, where N is the size of the original training set, was employed.
BaggingClassifier
Ensemble classifier for bagging with decision trees Leo Breiman proposed the bagging classifier, an ensemble method, in 1994 (Breiman,1994). Both classification and regression techniques are supported. Its aim is to increase the precision and stability of machine learning algorithms used for regression and classification. To create a final forecast, it combines the classifications of training sets created at random. By randomizing the creation process of such techniques, one can usually utilize them to reduce variance before building an ensemble from them. Bagging classifier has garnered a lot of interest because of its straightforward implementation and rising accuracy.
GradientBoostingClassifier
A class of machine learning techniques known as gradient boosting classifiers combines a number of weak learning models to produce a powerful predicting model. Gradient boosting frequently makes use of decision trees. Due to their success in categorizing large datasets, gradient boosting models are gaining popularity and have lately been successful in numerous Kaggle data science challenges(Friedman, 2000).
LogisticRegression
A statistical analysis method called logistic regression uses previous observations from a data set to predict a binary outcome, such as yes or no. By examining the correlation between one or more already present independent variables, a logistic regression model forecasts a dependent data variable. A logistic regression could be used, for instance, to forecast whether a candidate for office will win or lose, or if a high school student will be accepted into a particular institution or not. These simple choices between two options allow for binary outcomes(Wright,1995).
Proposed Methodology
The technique has been created to identify disorders like leukocytosis, anemia, and thrombocytopenia. On a set of predetermined features, the effectiveness of different machine learning classifiers has been evaluated for this blood illness detection. The effectiveness of the classifiers as determined by the dataset section's introduced feature sets. Cross-validation using the LOSO method is also used to determine the best model. Accuracy, specificity, sensitivity, MCC, and processing time are performance indicators for the model that are automatically calculated for classifier evaluation. These steps—dataset preprocessing, cross-validation, machine learning classifiers, and metrics for classifier performance evaluation—make up the proposed system methodology.
Experımental Desıgn Setup
In order to assess classifier performance, supervised classification experiments have been carried out. The performance of the classifiers was assessed using a subset of features in the first. With each classifier, the LOSO CV method is also used. Various performance evaluation metrics are computed to assess the classifiers' performances. The trials were all carried out in a Python environment using several machine learning libraries on a system with an Intel(R) Core(TM) i5-8250U CPU running at 1.60GHz and 1.80GHz.
Performance Evaluation
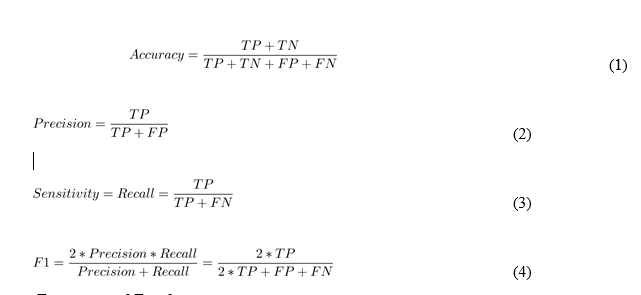
For classifier performance evaluation, various performance evaluation metrics have been utilized. The confusion matrix is used to calculate these measures. The binary classification matrix is displayed in Table 4. The performance evaluation measures listed below were calculated from Table 4 and are represented mathematically in Eqs. 1 through 5, respectively.
Experımental Results
In this experiment, the CV method is utilized with several ensemble learning classifiers and the specified characteristics. Additionally, classifiers use a variety of parameter values. The classifiers are first trained and validated using a subset of 3 features, then with 4 features, then with 6 features, then with 8, 10, and finally with 22 features. On 22 different feature sets, the classifiers perform rather well. Thus, table 1 using CV were built. Gradient Boosting Classifier is the best illness detection method for hemotological conditions, as evidenced by its 96
Discussion and Conclusion
In this study, an effective anemia, thrombocytopenia, and leukocytosis detection method based on machine learning has been constructed. In the system's architecture, machine learning classifiers such as Random Forest Classifier, Bagging Classifier, Gradient Boosting Classifier, and Logistic Regression, which is a single machine learning technique, are employed. After the evaluation of the performance, the results are showed that applying ensemble technique for hematological diseases are giving good results. In feature, we will conduct this work with genes data with same disease.
References
- Singh, H., Meyer, A. N., & Thomas, E. J. (2014). The frequency of diagnostic errors in outpatient care: estimations from three large observational studies involving US adult populations. BMJ quality & safety, 23(9), 727-731.
- Graber, M. L. (2013). The incidence of diagnostic error in medicine. BMJ quality & safety, 22(Suppl 2), ii21-ii27.
- Tomašev, N., Glorot, X., Rae, J. W., Zielinski, M., Askham, H., Saraiva, A., ... & Mohamed, S. (2019). A clinically applicable approach to continuous prediction of future acute kidney injury. Nature, 572(7767), 116-119.
- Shehab, M., Abualigah, L., Shambour, Q., Abu-Hashem, M. A., Shambour, M. K. Y., Alsalibi, A. I., & Gandomi, A. H. (2022). Machine learning in medical applications: A review of state-of-the-art methods. Computers in Biology and Medicine, 145, 105458.
- Badrick, T. (2021). Biological variation: Understanding why it is so important?. Practical Laboratory Medicine, 23, e00199.
- Shouval, R., Bonifazi, F., Fein, J., Boschini, C., Oldani, E., Labopin, M., ... & Nagler, A. (2017). Validation of the acute leukemia‐EBMT score for prediction of mortality following allogeneic stem cell transplantation in a multi‐center GITMO cohort. American journal of hematology, 92(5), 429-434.
- Arai, Y., Kondo, T., Fuse, K., Shibasaki, Y., Masuko, M., Sugita, J., ... & Atsuta, Y. (2019). Using a machine learning algorithm to predict acute graft-versus-host disease following allogeneic transplantation. Blood advances, 3(22), 3626-3634.
- Gal, O., Auslander, N., Fan, Y., & Meerzaman, D. (2019). Predicting complete remission of acute myeloid leukemia: machine learning applied to gene expression. Cancer informatics, 18, 1176935119835544.
- Gunčar, G., Kukar, M., Notar, M., Brvar, M., Černelč, P., Notar, M., & Notar, M. (2018). An application of machine learning to haematological diagnosis. Scientific reports, 8(1), 1-12.
- Malin, J. L. (2013). Envisioning Watson as a rapid-learning system for oncology. Journal of Oncology Practice, 9(3), 155.
- Deulofeu, M., Kolářová, L., Salvadó, V., María Peña-Méndez, E., Almáši, M., Štork, M., ... & Vaňhara, P. (2019). Rapid discrimination of multiple myeloma patients by artificial neural networks coupled with mass spectrometry of peripheral blood plasma. Scientific Reports, 9(1), 1-7.
- Elmore, J. G., Longton, G. M., Carney, P. A., Geller, B. M., Onega, T., Tosteson, A. N., ... & Weaver, D. L. (2015). Diagnostic concordance among pathologists interpreting breast biopsy specimens. Jama, 313(11), 1122-1132.
- Recht, M., & Bryan, R. N. (2017). Artificial intelligence: threat or boon to radiologists?. Journal of the American College of Radiology, 14(11), 1476-1480
- BREIMAN, L., 1999, Random forests—random features. Technical Report 567, Statistics Department
- L. Breiman. Random forests. Machine Learning, (2001). Vol(45); 5–32
- Friedman, J.H., 2000. Greedy function approximation: A gradient boosting machine. Ann. Statist. 29, 1189–1232
- Wright, R. E. (1995). Logistic regression.