Archive : Article / Volume 2, Issue 3
Case Report | DOI: https://doi.org/10.58489/2836-2322/023
Analysis of Some Physicochemical Properties and Dietary Risks Assessment of Pesticide Residues of Local Honey in Adamawa State, Nigeria
1Chemistry department, Modibbo Adama University (MAU) P.M.B 2076, Yola, Adamawa State Nigeria.
2Adamawa State College of Nursing and Midwifery, Yola, Nigeria.
3Department of Science Laboratory, Faculty of Life Sciences, Modibbo Adama University (MAU), Yola, P.M.B 2076, Adamawa State, Nigeria
Correspondng Author: Dowell B.F*
Citation: Dowell B.F, (2023). Analysis of Some Physicochemical Properties and Dietary Risks Assessment of Pesticide Residues of Local Honey in Adamawa State, Nigeria. Pharmacy and Drug Development. 2(3); DOI: 10.58489/2836-2322/023.
Copyright: © 2023 Dowell B.F, this is an open-access article distributed under the Creative Commons Attribution License, which permits unrestricted use, distribution, and reproduction in any medium, provided the original work is properly cited.
Received Date: 2023-04-07, Received Date: 2023-04-07, Published Date: 2023-08-28
Abstract Keywords: Dietary Risks Assessment, Honey, Pesticide residue, Physicochemical properties
Abstract
Pesticide residues bioaccumulation in the plants and during foraging in search of nectar by bees can caused health-related risks in human. This study investigated honey's physicochemical properties and dietary risk assessments of pesticide residues. This study's pesticide residues were determined using HPLC (LC 1200 series Agilent Tech). The mean values obtained for physicochemical parameters were: pH 3.52±0.02 -5.12±0.05; free acidity 6.50±0.07 -15.08±0.15 meq/kg; electrical conductivity 0.14±0.05 -0.55±0.03 mS/cm; moisture content 15.10±0.05-18.60±0.10% and ash content 0.03±0.01-0.36±0.02%. All the physicochemical parameters analyzed fall within the limits of international standards. The pesticide residues with the highest mean concentration in the honey samples were metachlor in sample HS3 (0.269±0.05 mg/kg) and atrazine (0.266±0.05 mg/kg) in HG3. Both aldrin, heptachlor and Permethrin were found below the EU MRL. EDIs for pesticide residues for adults and children were evaluated and compared with their acceptable daily intake (ADIs) value for each pesticide residue. Metachlor (4.48E-06 mg/kg/bw) and atrazine (4.43E-06 mg/kg/bw) were observed to have the highest EDIs for adults in samples HS3 and HG3 respectively. Similarly, atrazine (1.77E-05 mg/kg/bw) and metachlor (1.79E-05 mg/kg/bw) were observed to have highest EDI for children. All the EDIs evaluated for pesticide residues fall below acceptable daily intake (ADI). The target hazard quotient (THQ) and health index (HI) for pesticide residues in all the samples were < 1, this suggests no risks associated with the level of pesticide residues risks, thus having less danger to human health through its consumption.
Introduction
Honey is a supersaturated sugar solution. Its composition is complex and variable, containing at least 181 different substances (Alvarez-Suarez et al., 2010). These substances can mainly be divided into two groups: the major compounds such as the monosaccharides (glucose and fructose) and the minor compounds, including amino acids, enzymes, vitamins and minerals, and polyphenols (Bentabol et al., 2011). Some of the differences in the composition of honey are due to the differences between regions (floral sources) but seasonal differences can also be important (Najla, 2019). Honey authenticity studies are based on physicochemical parameters to assess variability and identify factors useful in sample discrimination. Measurement of these parameters can provide a good information value and validate the honey quality in terms of standard regulations (Raluca et al., 2014). Honey physicochemical quality criteria are well specified by the EC Directive 2001/110 (European Union Council, 2001). The major criteria of interest are pH, colour, moisture content, electrical conductivity, ash content, reducing and non-reducing sugars and free acidity.
Kavapurayil et al., (2014) analyzed the physicochemical, biochemical and antibacterial properties of Indian honey samples with special reference to their non-conformity. They reported that no honey ideally conformed to all parameter standards. They concluded that “Physicochemical value variations are indicative of inadequate honey harvesting and management that needs to be urgently tackled”. In the same vein, the physicochemical properties of honey samples collected from the Harenna forest, Bale, Ethiopia was carried out by Abera et al., (2013). They observed that synergetic effect of location and hive types showed significant differences in the values of reducing sugar, ash, acidity, HMF and specific rotation; whereas moisture, sucrose, water insoluble solid contents, pH, and electrical conductivity did not and that Traditional hive has no negative effect on quality factors of honey if honey harvesting, handling and processing is properly carried out. The low moisture content of honey forms an important part of the system which protects honey from attack by microorganisms as there is insufficient water available to support the growth of microorganism (Malika et al., 2005). Nevertheless, increase in moisture content (>20) of honey is indicative of adulteration following the USDA standard for water content (Adenekan et al., 2010 and Eleazu et al., 2013).
Oshomah and Agbaji (2015) carried out the physicochemical assessment of commercial honey from Edo state, Nigeria. They reported that the moisture percentage or water content of the honey samples were between 15.40±0.02 to 24.96±0.02. These are similar to the moisture percentage values obtained by Adenekan et al., (2010) for some honey samples in Ibadan, Nigeria. Electrical conductivity which depends on the mineral content of the honey (Malika et al., 2005) was found to range from 0.44±0.01 to 1.14±0.01 mS/cm. The pH values of the studied samples according to them were found to be acidic and range from 3.63±0.02 to 4.52±0.02 with a mean value of 4.05±0.22. This was due to different acids and minerals present in the honey samples.
Nor-Khaizura et al., (2018) determined the physicochemical and microbiological quality of commercial and traditional honey in Klang Valley. Eleven honey samples from different origins were obtained and examined. Commercial honey samples were labelled as A, B, C, D, E and F and traditional honey samples consisted of Yemeni Sidr honey, Red Tualang honey, Black Tualang honey, Acacia honey and Fraser Hills Tualang honey. Physicochemical quality such as sugar content moisture content, water activity, pH and color were measured. The pH value for commercial honey reached from pH 3.48 to 3.97 while the pH value for traditional honey reached from 3.07 to 4.72. The moisture content of commercial honey ranged from 17.53 % to 18.93 % compared to moisture content for traditional honey ranged from 18.03 % to 20.67 %. Total sugar content obtained for commercial honey varied from 79.27 to 81.73 g/mL while total sugar content obtained for traditional honey were slightly higher, from 80 to 83 .77 g/mL.
Comparative study of the effect of colour of honey samples on their physicochemical composition according to Eleazu et al., (2013) showed that there were indications that the colours of honey play important roles in classifying/grading different samples of honey. They reported that “lighter honeys could contain higher amounts of sugars than the darker honeys”. This shows that there could be a strong correlation between the colour of honey and its composition. They opine that the colour of honey could serve as a useful tool in classifying different honey samples on the basis of their phenolic contents, reducing sugars, antioxidant activities and pH. Mild honey is mild in flavour and a darker honey has a more pronounced flavour (Kayode and Oyeyemi, 2014).
Due to the important role of honey in Nigeria business enterprises, several of research efforts were channeled toward evaluating honey quality for human consumption. These efforts tend toward evaluating the physicochemical and biochemical components of the honey (Adebiyi et al.,2004; Lawal et al., 2009. Oladipupo and Isah, 2009, James et al., 2009; Buba et al, 2013; Ndife et al., 2014; Lullah-Deh et al., 2018), and microbial properties (Ndife et al., 2014 and Lawal et al., 2010) with no available data relating the dietary risk exposure of the pesticide residues in honey to public health.
Migration of pesticides and other agrochemicals into the foods chain were observed to infringe on the right to health and quality food and stood against environmental best practices (Gerage et al., 2017). These unwholesome agricultural practices were reported to leads to several health-related complications from pesticides poisoning. An estimated 3 million cases of pesticide poisoning and about 250,000 pesticide poisoning-related deaths are reported globally. From the figures presented, most of the reported cases were observed to emanate from the developing countries. The UN report shows only 35% of the developing countries had regulatory guidelines on pesticide (Project Syndicate, 2017). Relative to crops, meats, water and other edible plants, pesticides residues have been found in bee’s colony samples, beeswax, pollen, and bee bread (Eissa and Zidan, 2014; Essa et al., 2014).
Pesticides residues taken up by the bees during foraging, based on incomplete detoxification processes transfer most of the active metabolites into the honey products. The determination of pesticides residues in honey and other bee products has become a growing concern considering the growing popularity of honey in human daily diets. Its ingestion without knowing its source and safety might carry significant health hazards. Residual level of contamination cannot be changed through various production techniques, hence the need to study the physicochemical properties of honey and dietary risks of pesticide residues in the study area samples.
Materials and Methods
Materials and Chemicals/Reagents
pH meter, electrical conductivity meter, filter paper, electrical furnace crucibles, distilled water, deionized water, acidified water, sodium acetate, anhydrous magnesium sulphate, sodium hydroxide, methanol, acetonitrile, volumetric volumes, electric centrifuge, beaker, glass tubes, water bath, muffle furnace, polyethylene bottles, pipette, potassium chloride, HPLC (LC 1200 series Agilent Tech). All are analytical grade.
Study area and Geographical Location
Adamawa is a state in North-eastern Nigeria, with its capital at Yola. It is located between latitude 9°20′N and longitude 12°30′E (Figure 1). It occupied an area of 36,917 square kilometers. The state has population of 3,178,950 (NPC, 2006). Adamawa is one of the largest States of Nigeria, the State of Borno borders it to the Northwest, Gombe to the West and Taraba to the Southwest. It’s eastern bordered with Cameroon. It comprises of 21 local Government area.
Sample collection, Storage and Preservation
The honey samples were collected from three (3) local government areas of Adamawa state (Ganye, Song and Mubi North from the Southern, Central and Northern senatorial zones respectively). The samples were mixed to make a composite sample that represents each sampling location (Table 1). Six (6) composite samples were collected purposively from the bee-keepers farms namely: Sugu, Ganye I, Dirma, Shimba, Lokuwa and Yewa Hosere at different locations. Similarly, three (3) composite samples were purchased from retailers at different point (Ganye II, Song and Mubi) in the same geographical area. The samples were collected during dry season (January-March 2021). The collected samples were properly stored at room temperature and preserved to avoid loss due to poor storage, was timely analyzed to minimize loss due to prolonged storage. Samples were stored in polyethylene bottles preserved for analysis (Japhet et al., 2018).
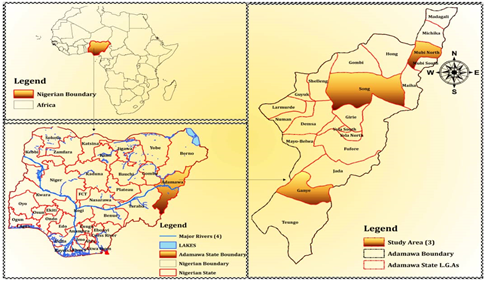
Figure 1: Map of the study Area (Google map 2020).
Table 1: Sample locations of honey and coding
L.G.A of the senatorial zones in Adamawa State | Sample Locations | Code |
Ganye (Southern Senatorial zone) | Sugu | HG1 |
Ganye I | HG2 | |
Ganye II | HG3 | |
Song (Central Senatorial zone) | Dirma | HS1 |
Shimba | HS2 | |
Song | HS3 | |
Mubi North (Northern Senatorial zone) | Lokuwa | HM1 |
Yewa Hosere | HM2 | |
| Mubi | HM3 |
Determination of Physicochemical Properties of Honey in the Samples
The physicochemical parameters were determined according to the methods described by Bogdanov et al; 2004, recognized by the International Honey Commission (IHC) and adapted by Saliha et al., 2016.
Determination of color
The color assessment of honey was carried out using a Hunter Lab, model D25 L optical sensor (Hunter Associates Reston, VA, USA). A 10 g of diluted honey was placed into a cylindrical optical cell. 45mm viewing aperture was used to measure the reflectance values (Shafiee et al., 2014).
Determination of pH
10 g of the aqueous honey solution was used to test the pH by using a digital pH meter at 28º±2ºC. The digital pH meter was calibrated first at 4.0 and 7.0 with standard buffer solutions ((International Honey Commission Method, 2009 and Saliha et al., 2016).
Determination of free Acidity
The free acidity of honey was determined by volumetric method (International Honey Commission Method, 2009). 10 ml of honey were dissolved in 75 ml of distilled water in a 250 ml beaker and solution was titrated with 0.1 M NaOH to pH 8.30. Results was expressed in meq/kg honey.
Determination of electrical Conductivity
This was determined by measuring 20 ml of honey and dissolved in 100 mL of distilled water mixed thoroughly to form solution. Electrical conductivity meter was immersed. The instrument was calibrated using potassium chloride (KCl) dissolved in water (de-ionized) and made up to 1 litre to be used as the standard reference solution (Bogdanov et al., 2004 and International Honey Commission Method, 2009).
Determination of Ash Content
The ash content was determined by heating 3 g of honey in a muffle furnace at 600ºC for 2 hours. After cooling, the ash content was determined (Bogdanov et al., 2004 and International Honey Commission Method, 2009).
Calculation
Where M1= Weight of the empty crucible, M2 = Weight of crucible + sample and M3 = Weight of crucible and the sample + ash
Determination of Moisture Content
The refractometer method was used to analyzed the moisture content by using Antago handled refractometer at ambient temperature 200C (Bogdanov et al., 2004 and International Honey Commission Method, 2009).
Determination of Pesticides Residues using HPLC
The extraction and purification of the pesticides (Aldrin, heptachlor, permethrin, metachlor and atrazine) residues from the honey samples prior to instrumental analysis were carryout based on the procedure described by Lehotay et al (2005). The respective honey samples, approximately 5 g was taken and dissolved in 10 ml de-ionized water. Followed by the addition of acetonitrile acidified with acetic acid (10 ml), 1.0 g sodium acetate and 4.0 g anhydrous magnesium sulphate after shaking for at least a minute. It was further shaken vigorously for another minute. It was then centrifugated at 4,000 rpm for two minutes, 6 ml of the extract was transfer into 15 ml glass tube containing 0.4 g primary secondary amine (PSA) sorbent and 0.6 g anhydrous magnesium sulphate. The formed mixture was then vigorously shaken for one minute and centrifuged at 4000 rpm for 2 minutes. The residue was dissolved in 2 ml of injection standard and passed through a 0.50 µm sized pore filter and quantified using HPLC.
The health risk assessment and hazard characterization of pesticides residue
To characterize the potential health risk of the pesticide’s residue in the honey, some assumption was factored into the mix to help in computing the HR indices. The Estimated Daily Intake (EDI) for the respective pesticides were estimated using the Equation 1 (USEPA, 1997 and Forkuoh et al., 2018).
The Ch is the pesticides concentration (mg/kg) in the honey, Hir represents the average honey consumption rate or intake rate for an average child and adults. The BW is the average body weight of children (15 kg) and adults (60 kg) (USEPA, 2000 and Akbari et al., 2012).
……………………………………………………………………… Equation 1
The potential non-carcinogenic risk from the consumption of the pesticides
The potential non-carcinogenic risk of pesticides was determined using the Target Hazard Quotient (THQ) and the health index (HI) expressions described in Equation 2 and Equation 3 respectively (USEPA, 1997)
…………………………………………………………………………Equation 2
The ADI values used in equation 2 represents the reference oral dose values set as an estimate for the tolerable daily intake of pollutants that will pose no health risk during a lifetime (USEPA, 1996; FAO/WHO, 2002, 2010; Bwatanglang and Magili, 2019 and Bwatanglang, 2019).
The HI, expressed as the sum of the THQ as described in equation 3 is the cumulative effect pose by the combination of the individual pesticides presents in the honey (Reffstrup et al., 2010 and Forkuoh et al.,2018).
HI = + ++….……………………………………………………..Equation 3
Were the EDIi represents the estimated daily intake dose of the individual pesticides (1, 2, 3….) in the honey and the ADIi is the acceptable daily intake dose
for the individual pesticides in honey (1, 2, 3……)
Statistical Analysis
The mean and standard deviation of the results were done using Minitab 19 and data was generated in triplicate. The results were express as Mean± SD
Results and Discussion
Physicochemical properties of honey
The Physicochemical analysis of honey samples were analyzed for Colour, pH, Electrical conductivity, Ash Content, Moisture Content and Free Acidity. The physicochemical properties of honey are related to quality of the honey. Therefore, checking the safety of the current honey produced in the study area is important to consumer’s health. The results of physicochemical parameters of the samples were expressed in their different units of measurement. The results were expressed as Mean± SD in triplicate and compared with the Codex and European Union Standards as can be seen in Figure 2, 3, 4, 5 and 6.
Colour
The results of the physicochemical analysis revealed that the colour of the honey samples from all the locations varied from light amber to amber and to dark amber. These colours were also in agreement with the colours of the honey samples reported by Lawal et al (2010), obtained from Ayeye, Apata, Omi- Adio, Iwo- Road and Eke- Ado in Ibadan Nigeria and Lullah et al (2018) obtained from seven different locations in Mambilla Plateau. The colours obtained from all the honey samples from Ganye, Song and Mubi- North Local Government Area were within the prescribed colours set by EU Commission, 2002 and Codex 2001.
Honey colour is very important in determination of its commercial use and market value. Darker honey is most often put to industrial use while lighter coloured honey are marketed directly for consumer. However, little is known about consumers colour acceptability of honey (Tanko et al., 2019).
pH
All the studied honey samples were acidic in nature. The mean pH values varied from 3.52±0.02 to 5.12±0.05 (Figure 2) and were within the recommended limit (pH 3.4 to 6.1) set in Codex Alimentarius Commission 2001 for honey that indicate freshness. Among all the honey samples analyzed, sample HM2 (pH 3.52±0.02) from Mubi- North was the most acidic. The values obtained from this study agrees with the pH range of 4.31- 6.02, 4.65- 5.14 and 3.22- 5.00 reported by Adebiye et al (2004), Lawal et al (2009), and Lullah- Deh et al (2018) respectively for Nigerian honey. Low pH has the ability to influence the texture, stability and shelf life of honey (Buba et al., 2013; El-Metwally, et al., 2015 and Boussaid et al., 2018).
The acidic pH of honey might be due to the constituent acids, mainly gluconic acid and minerals. The significance of pH at acidic range in foods cannot be overemphasized. They prevent the honey samples from constant infection by various species of micro-organisms and thus help to ensure constant shelf life for the honey samples. The pH values of honey are of great importance during storage, since the acidity can influence the texture, stability and shelf life of honey (Amril and Ladjama, 2013).
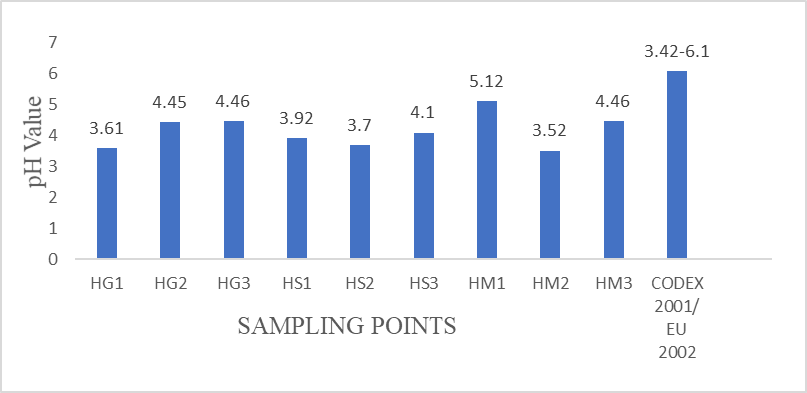
Figure 2: Mean pH values from honey samples Free acidity
The mean free acidity values from all the samples of honey in this study are within the range of 6.50±0.07 to 15.08±0.15 meq/kg (Figure 3). The highest free acidity was observed from sample HM3 (Mubi-North). The acidity in honey is due to the occurrence of organic acids in honey, predominately gluconic acid. (Terrab et al., 2004). The acidity of honey contributes a lot to impart flavor and help to increase its stability
against micro-organisms. All the samples analyzed in this study were within the recommended limit set out in the guideline of Codex, 2001 and EU Commission, 2002, which should not be more than 50 meq/kg.
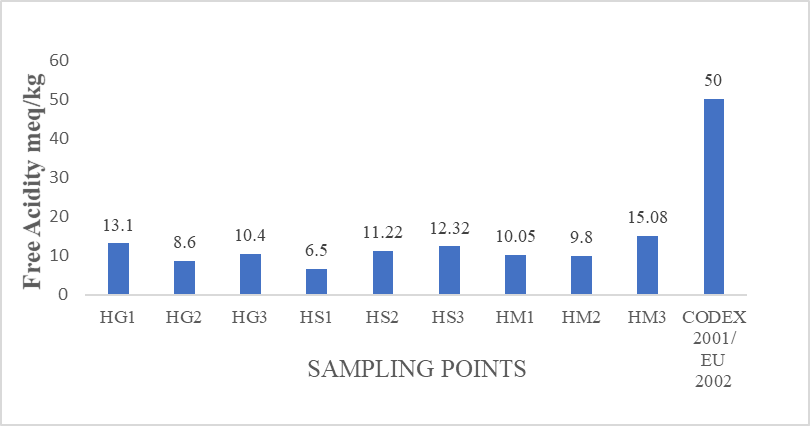
Figure 3: Mean Free Acidity (meq/kg) values from honey samples
Electrical Conductivity
The mean values of Electrical Conductivity in the samples obtained from all the locations studied were within the range of 0.14±0.05- 0.55±0.03 mS/cm (Figure 4). These values are below the maximum limit indicated by the international regulations of quality (Codex, 2001 and EU council, 2002) for honey as shown in Figure 4. Electrical Conductivity very often used in routine honey control instead of ash content (Zahedi et al., 2018). The EC values obtained in this study are in agreement with results of Adenekan et al., (2010) which shows E.C values between 0.25- 0.64 mS/cm. Lullah-Deh et al (2018) studied the electrical conductivity of seven honey samples from Mambilla Plateau, Nigeria in the range of 7.6 to 12.4 µS/m.
Iftikhar et al., (2014) studied the electrical conductivity of local and imported brands of Islamabad market in Pakistan ranged from 0.08- 0.80 mS/cm. Buba et al (2013) reported the electrical conductivity of honey samples from North-East Nigeria range from 0.05- 0.41 ms/cm. Goncalves et al., (2018) determined the electrical conductivity of selected Portuguese commercial monofloral honey samples ranges from
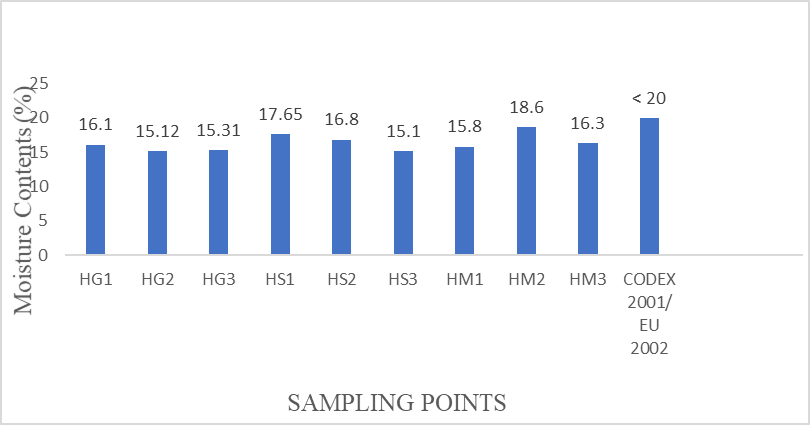
Figure 5: Mean Moisture Content (%) values from honey samples
Ash Content
Ash content is a reflection of the total mineral content of honey. It is an essential component of food which contains catalyst
required for various body functioning reaction to sustain good health. The average mean ash content from the samples analyzed varied from 0.03±0.01 to 0.36±0.02 % (Figure 6). In this study, honey samples from all the studied areas had mean of ash values (%) below the maximum limit recommended by Codex and EU Commission of 0.60 % (Codex Alimentarius, 2001 and EU, 2002).
This variability in ash content could be explained by floral source of the honey, soil condition, atmospheric conditions and physiology of each plant (Kumar et al., 2018). Several investigations have shown that the ash content of honey depends mainly on the botanical origin of honey, i.e., light blossom honey have low contents than dark honeys such as honeydew, chenuts and heather honey (Kumar et al., 2018).
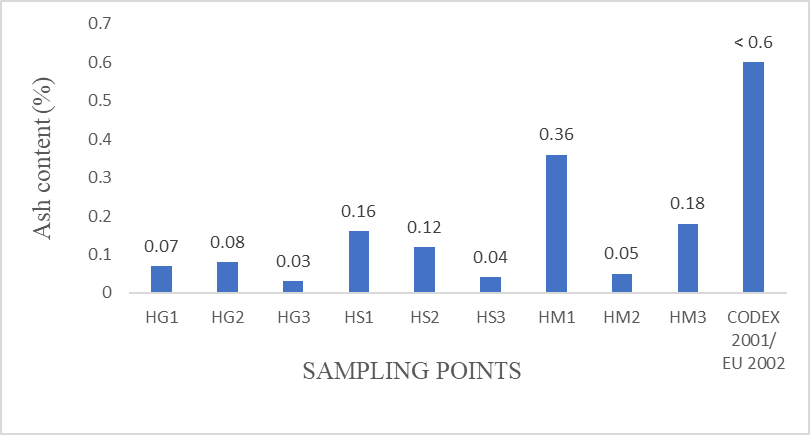
Figure 6: Mean Ash Content (%) values from honey samples
Determination of Pesticide Residues
Determining pesticide residues in all the sampling points was done using HPLC (LC 1200 Series, Agilent Tech). Aldrin, heptachlor, permethrin, metachlor, and atrazine were the pesticide residues analyzed in this study. The Health Risks Assessment, Target Hazard Quotient and Health Index was estimated using various mathematical expressions (Forkuoh et al., 2018; USEPA, 1997 and Reffstrup et al., 2010) and results presented in Tables 4.6 to 4.8
Table 4.6: Mean Concentrations of Pesticide Residues (mg/kg) in Honey samples
Sample locations | Sampling points | Atrazine | Metolachlor | Aldrin | Heptachlor | Permethrin |
GANYE | HG1 | ND | 0.007±0.00 | ND | ND | ND |
HG2 | ND | 0.002±0.00 | ND | ND | ND | |
HG3 | 0.266±0.05 | ND | ND | ND | ND | |
SONG | HS1 | 0.057±0.02 | 0.139±0.03 | ND | ND | ND |
HS2 | ND | 0.003±0.00 | ND | ND | ND | |
HS3 | 0.007±0.00 | 0.269±0.05 | ND | ND | ND | |
MUBI NORTH | HM1 | 0.008±0.00 | 0.023±0.01 | 0.002±0.00 | 0.001±0.00 | ND |
HM2 | 0.088±0.01 | 0.195±0.04 | ND | ND | ND | |
HM3 | 0.018±0.00 | 0.038±0.01 | ND | ND | ND |
ND = Not Detected
The mean concentration of pesticide residue
The Mean± SD concentration of pesticide residues in all the samples analyzed from Ganye, Song and Mubi-North are presented in table 4.6. The results obtained were compared with the maximum residue limits (MRL) for pesticides in honey (EC, 2005; Darko et al., 2017). The MRLs for the pesticides in honey were adopted from EU MRL due to lack of available MRL for honey in Codex Alimentarius Commission. An MRL of 0.01 mg/kg set by European regulation 396/2005 EC were adopted for substances which no MRL were allocated (EC, 2005).
The pesticide with the highest mean concentrations in the honey samples was metachlor collected in sampling point HS3 from Song (0.269±0.05 mg/kg) (see Table 4.6). Atrazine has the second highest mean concentration of pesticide residues (0.266±0.05 mg/kg) in HG3 from Ganye (Table 4.6). The mean concentration of pesticide residues for Metachlor in samples HS1, HS3, HM1, HM2, HM3 and Atrazine in sample HG3, HS1, HM2 and HM3 were found to be above the MRL (Table 4.6).
Aldrin and Heptachlor residues were only detected in sample HM1 (0.002±0.00 mg/kg and 0.001±0.00 mg/kg) respectively. Permethrin residues was not detected in any of the sample analyzed. Both Aldrin, Heptachlor and Permethrin were found to be below the MRL. The results from this study agrees with several studies detecting residual of pesticides in honey. In a study by Kumar and Bidi (2018), about 72 % of market honey samples from northern India were positive for both organophosphate and organochlorine pesticides. About 0.013, 0.012 and 0.005 mg/kg of deltamethrin, chlorpyrifos and endosulfan residues were detected in raw honey samples from Pakistan (Farooqi et al., 2015). Several researchers also reported the presence of pesticide residues in honey samples and bee products (Bermejo et al., 2010; Johnson et al., 2010; Bwatanglang et al., 2019).
The high level of pesticide residues in the samples analyzed in this study could be from residues bioaccumulation in the plants and during foraging in search of nectar. According to Panseri et al., (2014), organochlorine pesticides in contaminated soil may possibly enter into human food web through non-fatty food products like honey. The proximity to the beehive farms to agricultural farmlands also contribute to the likelihood of bees foraging on pesticides contaminated with nectar from the nearby crops and plants (De Oliveira et al., 2016).
All the samples from Mubi-North contains Atrazine and Metachlor. Aldrin and Heptachlor was only recorded in samples from Mubi-North. Samples from Mubi-North happened to record higher pesticides in all the samples. This may be due to the fact that the town is engaged with much commercial activities.
Potential health risk of pesticide residues associated with consumption of honey samples
The results of health risk assessment for pesticide residues were presented in Table 4.7. The estimation of average daily intake (EDIs) of the detected pesticide residues for both adults and children in the samples analyzed were evaluated and compared with the acceptable daily intake (ADIs) values for each pesticide residues (Table 4.7). Based on the pesticide residues detected in all the sampling points, Atrazine (4.43E-06 mg/kg/bw) and Metachlor (4.48E-06 mg/kg/bw) were found to possess the highest EDIs for adults in sample HG3 and HS3 respectively. Similarly, Atrazine (1.77E-05 mg/kg/bw) and Metachlor (1.79E-05 mg/kg/bw) were observed to have the highest EDIs for children in same sampling points HG3 and HS3 respectively (Table 4.7).
The EDIs for Aldrin (3.33E-08 mg/kg/bw) and (1.33E-07 mg/kg/bw) in adults and children respectively was only found in sample HM1 from Mubi-North. Furthermore, EDIs for Heptachlor (1.67E-08 mg/kg/bw) and 6.67E-08 mg/kg/bw) for adults and children respectively was only recorded in sample HM1 from Mubi-North. No EDIs for Permethrin recorded in all samples from the study area. From the results, it was observed that all the EDIs evaluated in all the sampling points falls below acceptable daily intake (ADIs) and cumulative effect for each pesticides level set by the European Union as a standard.
Eissa et al., (2014) detected organochlorine and organophosphorus metabolites in 55.6% of honey samples of the honey samples used in the study. Even though, 81.8% of the pesticides residue detected in the study falls above the MRL set by the European Union, the EDI calculated for each pesticide in the honey were observed to be much lower than acceptable daily intakes (ADIs).
Target Hazard Quotient (THQ) and Health Index (HI) for pesticide residues
The results of THQ and HI for potential carcinogenic and non-carcinogenic health risk were evaluated by integrating the EDI with the ADI for the estimation of target hazard quotient (THQ). The health index (HI) were evaluated by summation of each THQ of pesticide residues recorded. The results are presented in Table 4.8. Based on the results evaluated for both THQ and HI, shows that the exposure to pesticides through dietary consumption possess no immediate effect to human health. The THQ and HI for pesticide residues in all the samples were < 1> 1) one for pesticide residues suggest potential male toxicity. Bwatanglang et al (2019) evaluated the THQ and HI for pesticide residues in Raw honey samples (RHS) and Commercial honey sample (CHS) from Hong and Mubi were all less than (< 1>
Table 4.7: Estimated Daily Intake (EDI) in mg/kg/bw for Pesticide Residues
ADULTS | ||||||||||
GANYE | SONG | MUBI NORTH | ||||||||
PESTICIDES RESIDUES | HG1 | HG2 | HG3 | HS1 | HS2 | HS3 | HM1 | HM2 | HM3 | ADIS |
Atrazine | ND | ND | 4.43E-06 | 9.50E-07 | ND | 1.17E-07 | 1.33E-07 | 1.47E-06 | 3.00E-07 | 3.50E-02 |
Metachlor | 1.17E-07 | 3.33E-08 | ND | 2.32E-06 | 5.00E-08 | 4.48E-06 | 3.83E-07 | 3.25E-06 | 6.33E-07 | 5.00E-03 |
Aldrin | ND | ND | ND | ND | ND | ND | 3.33E-08 | ND | ND | 1.00E-04 |
Heptachlor | ND | ND | ND | ND | ND | ND | 1.67E-08 | ND | ND | 1.0E-04 |
Permethrin | ND | ND | ND | ND | ND | ND | ND | ND | ND | 5.00E-02 |
CHILDREN | ||||||||||
GANYE | SONG | MUBI NORTH | ||||||||
PESTICIDES RESIDUES | HG1 | HG2 | HG3 | HS1 | HS2 | HS3 | HM1 | HM2 | HM3 | ADIS |
Atrazine | ND | ND | 1.77E-05 | 3.80E-06 | ND | 4.67E-07 | 5.33E-07 | 5.87E-06 | 1.20E-06 | 3.50E-02 |
Metachlor | 4.67E-07 | 1.33E-07 | ND | 9.27E-06 | 2.00E-07 | 1.79E-05 | 1.53E-06 | 1.30E-05 | 2.53E-06 | 5.00E-03 |
Aldrin | ND | ND | ND | ND | ND | ND | 1.33E-07 | ND | ND | 1.00E-04 |
Heptachlor | ND | ND | ND | ND | ND | ND | 6.67E-08 | ND | ND | 1.00E-04 |
Permethrin | ND | ND | ND | ND | ND | ND | ND | ND | ND | 5.00E-02 |
Table 4.8 Target Hazard Quotient (THQ) and Health Index (HI) for Pesticide Residues
|
| ADULTS | |||||||
GANYE | SONG | MUBI NORTH | |||||||
PESTICIDES | HG1 | HG2 | HG3 | HS1 | HS2 | HS3 | HM1 | HM2 | HM3 |
Atrazine | 0.00E+00 | 0.00E+00 | 1.27E-04 | 2.71E-05 | 0.00E+00 | 3 .34E-06 | 3.80E-06 | 4.20E-05 | 8.57E-06 |
Metachlor | 2.34E-05 | 6.66E-06 | 0.00E+00 | 4.64E-04 | 1.00E-05 | 8.96E-04 | 7.66E-05 | 6.50E-04 | 1.27E-04 |
Aldrin | 0.00E+00 | 0.00E+00 | 0.00E+00 | 0.00E+00 | 0.00E+00 | 0.00E+00 | 3.33E-04 | 0.00E+00 | 0.00E+00 |
Heptachlor | 0.00E+00 | 0.00E+00 | 0.00E+00 | 0.00E+00 | 0.00E+00 | 0.00E+00 | 1.67E-04 | 0.00E+00 | 0.00E+00 |
Permethrin | 0.00E+00 | 0.00E+00 | 0.00E+00 | 0.00E+00 | 0.00E+00 | 0.00E+00 | 0.00E+00 | 0.00E+00 | 0.00E+00 |
HI | 2.34E-05 | 6.66E-06 | 1.27E-04 | 4.91E-04 | 1.00E-05 | 8.99E-04 | 5.80E-04 | 6.92E-04 | 1.36E-04 |
CHILDREN | |||||||||
GANYE | SONG | MUBI NORTH | |||||||
PESTICIDES | HG1 | HG2 | HG3 | HS1 | HS2 | HS3 | HM1 | HM2 | HM3 |
Atrazine | 0.00E+00 | 0.00E+00 | 5.06E-04 | 1.09E-04 | 0.00E+00 | 1.33E-05 | 1.52E-05 | 1.68E-04 | 3.43E-05 |
Metachlor | 9.34E-05 | 2.66E-05 | 0.00E+00 | 1.85E-03 | 4.00E-05 | 3.58E-03 | 3.06E-04 | 2.60E-03 | 5.06E-04 |
Aldrin | 0.00E+00 | 0.00E+00 | 0.00E+00 | 0.00E+00 | 0.00E+00 | 0.00E+00 | 1.33E-03 | 0.00E+00 | 0.00E+00 |
Heptachlor | 0.00E+00 | 0.00E+00 | 0.00E+00 | 0.00E+00 | 0.00E+00 | 0.00E+00 | 6.67E-04 | 0.00E+00 | 0.00E+00 |
Permethrin | 0.00E+00 | 0.00E+00 | 0.00E+00 | 0.00E+00 | 0.00E+00 | 0.00E+00 | 0.00E+00 | 0.00E+00 | 0.00E+00 |
HI | 9.34E-05 | 2.66E-05 | 5.06E-04 | 1.96E-03 | 4.00E-05 | 3.59E-03 | 2.32E-03 | 2.77E-03 | 5.40E-04 |
Conclusion
The physicochemical properties showed the variability of some quality characteristics of honey samples from the different sampling locations. The honeys were mostly of good quality when compared with several international standards of honey specifications. However, the difference in composition and quality parameters of the honey samples may also be influenced by factors such as differences in climatic conditions, soil characteristics, honey bee specie, the activity of the bee, environmental temperature, harvesting methods and storage conditions. This current study also revealed the presence of some pesticide residues in local honey consumed in the study area. The potential human health risks associated with exposure of pesticides residue from the study area were found to be lower than each acceptable daily intake (ADI) but the presence of pesticide residues in honey is a health concern. Due to the smaller body weight (15 kg) and physiological susceptibility in children, the EDI were observed to be higher in children than that of the adults.
References
- Abera, B., Solomon, W.K., Geremew, B., Nuru, A. and Samuel, M. (2013). Physicochemical properties of the Harenna forest honey, Bale, Ethiopia. Food Chemistry, 141: 3386– 3392.
- Adebiyi FM, Apkan I, Obiajunwa EL, Olaniyi HB (2004). Chemical/physical characterization of Nigeria honey. Pakistan Journal of Nutrition. pp 3:27-281
- Adenekan M. O., N. A. Amusa, A. O. Lawal and V. E. Okpeze (2010). Physico-chemical and microbiological properties of honey samples obtained from Ibadan. Journal of Microbiology and Antimicrobials Vol. 2(8), pp. 100-104. Available online ISSN 2141-2308 ©2010 Academic Journals
- Akbari B, Gharanfoli F, Khayyat MH, Khashyarmanesh Z, Rezaee R, Karimi G (2012). Determination of heavy metals in different honey brands from Iranian markets. Food Addit Contam Part B Surveill. pp 5(2):105-11
- Alvarez, S., Tulipani, S. R. and Battino, M. (2010). Contribution of honey in nutrition and human health. Mediterranean Journal of Nutrition and Metabolism 3: 15-23.
- Amril, A. and Ladjama, A. (2013). Physicochemical chara-cterization of some multifloral honeys from honeybees Apismelliferacollected in the Algerian northeast. African Journal of Food Science, 7(7): 168 – 173.
- Bermejo FJO, Pajuelo AG, Megías MM, Pinar CTF (2010). Pesticide residues in beeswax and beebread samples collected from honey bee colonies (Apis mellifera L.) in Spain. Possible implications for bee losses. J. Apic. Res; pp: 48:243-250.
- Bentabol A. Manzanares, Z. H. Garc´ıa, B. R. Gald´ on, E. R. Rodr´ıguez, and C. D. Romero, (2011). “Differentiation of blossom and honeydew honeys using multivariate analysis on the physicochemical parameters and sugar composition,” Food Chemistry, vol 126, no. 2, pp. 664–672, 2011.
- Bogdanov S., K. Ruof, and L. P. Oddo (2004). “Physico—chemical methods for the characterization of uniforal honeys: a review,” Apidologie, vol. 35, supplement 1, pp. S4–S17.
- Boussaid A, Chouaibi M, Rezig L, Hellalc R, Dons F, Ferrari G, Hamdi S (2018). Physicochemical and bioactive properties of honey from various floral origin of Tunisia, Arabian Journal of Chemistry. pp: 11:265-274
- Buba F, Gidado A, Shugaba A (2013). Analysis of Biochemical Composition of Honey Samples from North-East Nigeria. Biochem Anal Biochem.; 2:3. DOI: 10.4172/2161-1009.1000139
- Bwatanglang I (2019). Diclorvos-Mediated Heavy Metal Uptake in Leafy Vegetables and Potential Health Risk on Consumption London Journal of Research in Science: Natural and Formal. 19(3): 15-24
- Codex Alimentations (2001). Draft revised standard for standard for honey (at step 10 of the Codex procedure). Alinorm; 01 (25):19–26
- Commission regulation (EU) (2010) No 165/2010 on amending Regulation (EC) No 1881/2006 setting maximum levels for certain contaminants in foodstuffs as regards aflatoxins. Off. J.
- Darko G, Tabi JA, Adjaloo MK, Borquaye LS (2017). Pesticide Residues in Honey from the Major Honey Producing Forest Belts in Ghana. Journal of Environmental and Public Health. DOI.org/10.1155/2017/7957431
- De Oliveira RC, do Nascimento Queiroz SC, da Luz CFP, Porto RS, Rath S (2016). Bee pollen as a bioindicator of environmental pesticide contamination. Chemosphere; 163:525-534.
- Dolan, J. W (2002). Peak Tailing and Resolution. LC●GC Europe, pp 34-36. EC. 2015. Honey (2015-17). JRC Technical Reports. Ref. Ares (2016)6932951-13/12/2016.
- Eissa A.A., Hassan A.S.M., Rahman T.A, (2014). Determination of total Aflatoxins and Carbamate Pesticide Residues in Some Bee Honey Samples Using QuEChERS Method and High-Performance Liquid Chromatography. Food Public Health. 4(5), 209-213
- Eleazu, C. O., Iroaganachi, M. A., Eleazu, K. C. and Okoronkwo, J. O. (2013). Determination of the physicochemical composition, microbial quality and free radical scavenging activities of some commercially sold honey samples in Aba, Nigeria: The effect of varying colours. International Journal of Biomedical Research, 4 (1): 32-41.
- EL-Metwally AAE (2015). Factors Affecting the Physical and Chemical Characteristics of Egyptian Beehoney. Ph. D. Thesis, Fac. Agric. Cairo Univ; 320p.
- EU Council (2001). Council directive of 20th December relating to honey 2001/110/EC. Official Journal of the European Communities, L10:47-52.
- EU Council (2002). Council directive of 25h December relating to honey 2002/120/EC. Official Journal of the European Communities, L10:45-50.
- European Union Commission Regulation (EC) (2005). No 396/2005 of the
- European Parliament and of the Council of 23 February 2005 on maximum residue levels of pesticides in or on food and feed of plant and animal origin and amending council directive 91/414/E-text with EEA Relevance.
- FAO/WHO (2010). Pesticide residues in food and feed. Acceptable Daily Intake; Codex Alimentarius Commission, FAO/WHO Food Standards. International Journal of Chemical Studies.
- FAO/WHO (2002). Report of the thirty-fourth Session of the codex committee on pesticide residues. Food and Agriculture Organization of the United Nations/World Health Organization. The Hague, Netherlands.
- Farooqi MA, Sabri MA, Javed N (2015). Assessment of Insecticide Residues in Raw Honey by High Performance Liquid Chromatography with Ultraviolet Detection. Pakistan Journal of Zoology, 47(4).
- Forkuoh F, Boadi NO, Borquaye LS, Aful S (2018). Risk of Human Dietary Exposure to Organochlorine Pesticide Residues in Fruits from Ghana. Scientific report; 8:16686. DOI:10.1038/s41598-018-35205-w
- Gerage JM, Meira APG, da Silva MV (2017). Food and nutrition security: pesticide residue in food. Nutrire; 42:3. DOI 10.1186/s41110-016-0028-4
- Getachew, A; Gizaw, H; Assefa D and Tajebe, Z (2014). Physicochemical properties of honey produce in Masha, Gesha and Sheko districts in Southwest Ethiopia. Current Research in Agricultural Sciences, 1(4): 110-116
- Gomes, S., Dias, L. G., Moreira, L. L., Rodrigues, P. and Estevinho, L. (2010). Physicochemical, microbiological and antimicrobial properties of commercial honeys from Portugal. Food and Chemical Toxicology, 48 (2): 544-548.
- Goncalves J, Ribeiro I, Marcalo J, Rijo P, Faustino C, Pinheiro L (2018). Physicochemical, antioxidant and antimicrobial properties of selected Portuguese Commercial monofloral honeys.; 6(10): 645-654
- Iftikhar, F., Mahmood, R., Islam, N., Sarwar, G., Masood, M. and Shafiq, H. (2014). Physicochemical analysis of honey samples collected from local markets of Rawalpindi and Islamabad, Pakistan., 4 (2): 35-40.
- International Honey (2009) Commission Methods: Harmonized methodsof International Honey Commission Methods, Swiss Bee Research Centre, FAM, Liebefeld, Swizeland,
- James, O. O., Mesutri, M. A., Usman, L. A., Yeye, S. O., Ajanaku, K. O., Ogunniran, K. O., Ajani, O. O. and Siyanbola.Y.O. (2009). Physical characterization of some honey samples from North-Central Nigeria. International Journal of Physical Science. 4 (9): 464 –470.
- Japhet Amanah Lullah-Deh, Muluh Emmanuel Khan, Ishaq Shaibu Eneji, (2018). Physicochemical characteristics of honey samples from Mambilla Plateau, Nigeria. Journal of Biomaterials; 2(1):7-
- Johnson RM, Ellis MD, Mullin CA, Frazier M (2010). Pesticides and honey bee toxicity. Apidologie; 16:67-78.
- Kavapurayil, J.B., Karalam, S. and Chandran, R.P. (2014). Analysis of physicochemical, biochemical, and antibacterial properties of Indian honey samples with special reference to their non-conformity. Acta Alimentaria, 43 (1): 9–18.
- Kayode, J. and Oyeyemi, S. D. (2014). Physico-Chemical study and analysis of Pollen grains in some commercial honey samples found in Ondo State, Nigeria. International Journal of Basic and Applied Science, 3 (2): 63-
- Kumar A, Gill JPS, Bedi JS (2018). Multiresidue determination of pesticides in market honey from northern India using QuEChERS approach and assessment of potential risks to consumers. Current Science; 115(2):283.48.
- Lawal AO, Adenekan MO, Amusa AN, Okpeze VE (2010). Physicochemical and Microbiological properties of Honey samples obtained from Ibadan. Journal of Microbiology and Antimicrobes; 2(8):100–104
- Lawal RA, Lawal AK, Adekalu JB (2009). Physicochemical Studies on Adulteration of Honey in Nigeria. Pakistan Journal of Biological Science; 12(15):1080-1084.
- Lehotay SJ, kaserina M, Lightfield AR (2005). Use of buffering and means to improve results of problematic pesticides in a fast and easy method for residue analysis of fruits and vegetables. J.A O. A C Int; 88(2):615.
- Lullah-Deh JA, Khan ME, Eneji IS (2018). Physicochemical Characteristics of Honey Samples from Mambilla Plateau, Nigeria. Journal of Biomaterials. pp; 2(1):7-11
- Malika N, Mohamed F. Chakib E (2005). Microbiological and physicochemical properties of Moroccan honey. International Journal of Agriculture and Biology; 7(5):773- 776
- Najla A. Albaridi, (2019). “Antibacterial Potency of Honey,” Divisions of Nutrition and Food Sciences, Princess Nourah Bint Abdulrahman University, Riyadh, Saudi Arabia, International Journal of Microbiology Volume, Article ID 2464507,10 pages
- Ndife J, Abioye L, Dandago M (2014). Quality Assessment of Nigerian Honey Sourced from different Floral Locations. NIFOJ. 2014; 32(2):48-55
- Oladipupo MD, Isah MC (2009). Physical and Chemical properties of some Nigerian honey. Nigerian Journal of Research and Production; 15(2):4.
- Omafuvbe, B. O. and Akanbi, O. O. (2009). Microbiological and physico-chemical properties of some commercial Nigerian honey. African Journal of Microbiology Research, 3 (12): 891-896.
- Panseri S, Catalano A, Giorgi A, Arioli F, Procopio A, Britti D, (2014). Occurrence of pesticide residues in Italian International Journal of Chemical Studies honey from different areas in relation to its potential contamination sources. Food Control; 38:150-156.
- Raluca, D. I., Ana, M. J., Iulian, M., Teodora, C., Paula, P. and Cristina, M. (2014). Characterization of Romanian Honey Based on Physico-Chemical Properties and Multivariate Analysis. Revista de Chimie-Bucharest, 65: 381-385.
- Refstrup TK, Larsen JC, Meyer O (2010). Risk assessment of mixtures of pesticides. Current approaches and future strategies. Regul. Toxicol. Pharmacol; 56, 174–192
- Shafiee, S., Minaei, S., Moghaddam-charkari, N., & Barzegar, M. (2014). “Honey Characterization Using Computer Vision System and Artificial Neural Networks” in Food Chemistry, 159, pp. 143–150.
- Tanko Bako, Ezekiel Ambo Mamai, Boman James Bature (2019). Determination of quality parameters of honey from Taraba State- Nigeria. Chemical and Biomolecular Engineering Vol:4; No.1, pp 1-9. Doi: 10.11648/j.cbe.20190401.11
- Terrab, A; Gonzalez-Miret L, and Heredia, F.J (2004). Color characterization of thyme and avocado honey by diffuse reflectance spectroscopy and Spectro radiometry. European Food Research Technology, 218(5) 488-492.
- USEPA (1997). Environmental Protection Agency. Exposure factors handbook. Office of Research and Development, Washington, DC: U.S
- USEPA. U.S. Environmental Protection Agency (2002). A Review of the Reference Dose and Reference concentration Processes, EPA/630/p-02/002F, Washington, DC: U.S.
- Zahedi Namini., Mousavi M.H., Mohamoudi R and Hassanzadeh P. (2018). Hygienic quality of honey samples produced in the Iran in comparison with International Standards. International Food Research Journal 25(3): 982-988.