Current Issue : Article / Volume 3, Issue 1
- RESEARCH ARTICLE | DOI:
- https://doi.org/10.58489/2836-3590/019
Spatial Analysis of Response Initiative to the outbreak of Diphtheria in Ojo Local Government Area of Lagos State, Nigeria.
1Department of Surveying and Geoinformatics, The Federal University of Technology, Akure, Ondo State, Nigeria.
Ijaware Victor Ayodele*
Ijaware Victor Ayodele, Jayeoba Emmanuel Temitope, (2024). Spatial Analysis of Response Initiative to the outbreak of Diphtheria in Ojo Local Government Area of Lagos State, Nigeria. Pollution and Effects on Community Health, 3(1). DOI: 10.58489/2836-3590/019
© 2024 Ijaware Victor Ayodele, this is an open-access article distributed under the Creative Commons Attribution License, which permits unrestricted use, distribution, and reproduction in any medium, provided the original work is properly cited.
- Received Date: 21-04-2024
- Accepted Date: 30-05-2024
- Published Date: 11-05-2024
Diphtheria Outbreak (DO), Hotspot Mapping (HM), Analytic Hierarchy Process (AHP), Geographic Information Systems (GIS), Composite Risk Index (CRI)
Abstract
In the Africa Continent, diphtheria remains a pressing public health concern. Despite advancements in healthcare infrastructure and vaccination efforts, several countries continue to report cases and outbreaks, indicating ongoing transmission of the disease. This research aimed at utilizing GIS application in diphtheria outbreak in the Ojo Local Government Area (LGA) of Lagos State, Nigeria, with the following objectives: (i) obtain the spatial distribution pattern of the spread of diphtheria outbreak. (ii) determine the area requiring immediate attention and response in the study area. (iii) showcase areas that are vulnerable within the study area. In the pursuance of this both primary data, including geographical coordinates of confirmed diphtheria cases, and secondary data such as recorded cases, population density, vaccination coverage, and transportation networks, the research utilizes ArcGIS for visualization and analysis, Differential Global Positioning System (DGPS) receivers ensured accurate spatial data collection, supplemented by ground truthing of secondary data. The result revealed significant clusters of diphtheria cases in Akesan-Obadore and Ijegun, indicating a higher concentration of infections. The study applied average nearest neighbor analysis, which indicated a dispersed pattern of outbreaks within the LGA. Furthermore, a risk assessment using Analytic Hierarchical Process (AHP), in identifying the southern parts and Iba ward of Ojo LGA as areas with highest risk. The study recommends to the Lagos State Government to enhance vaccination efforts and improve sanitation infrastructure in these high-risk areas to mitigate the spread of diphtheria.
Introduction
Diphtheria, caused by the bacterium Corynebacterium diphtheriae, remains a pressing global public health concern due to its highly contagious nature. Despite extensive vaccination efforts, outbreaks persist worldwide, particularly in regions with low vaccination coverage and limited healthcare access (Lodeiro-Colatosti et al., 2018). African countries, including Nigeria, Ethiopia, and the Democratic Republic of the Congo, continue to grapple with diphtheria due to socio-economic factors and deficiencies in healthcare infrastructure (Dikid et al., 2013). Nigeria, with its dense population and diverse healthcare challenges, faces significant hurdles in controlling diphtheria despite persistent efforts to control the disease (NCDC, 2003; Olulaja et al., 2023). Despite efforts focusing on vaccination coverage and healthcare infrastructure improvement, localized outbreaks persist (Obansa & Orimisan, 2013). Lagos State, a notable hotspot for diphtheria transmission within Nigeria, encounters unique challenges due to its urban density and socio-economic dynamics. Some of these challenges include: (i) lack of comprehensive evaluation of diphtheria outbreak in Lagos State, particularly in the Ojo LGA (ii) insufficient evaluation of specific risk factors associated with diphtheria outbreak in the study area. (iii) current response strategies lack spatial precision and up-to-date monitoring capabilities.
Therefore, the goal of this research is to analyze response initiative to diphtheria outbreak using geospatial techniques in Ojo LGA, Lagos State, Nigeria with a view to understand spatial patterns and facilitate targeted response planning. The following research questions give impetus for the research aim to be achieved: (i) what are the spatial distribution pattern of the spread of diphtheria outbreak in the study area? (ii) what are the areas that require immediate attention and response? (iii) what are the areas vulnerable to diphtheria?
Addressing these problems will provide valuable insights for public health authorities, policymakers, and stakeholders in Lagos State. This research contributes to the development of evidence-based interventions, targeted prevention measures, and spatially informed decision-making processes to effectively control and prevent diphtheria outbreaks in Lagos State, Nigeria.
Literature Review
Diphtheria, caused by Corynebacterium diphtheriae, remains a global health concern despite vaccination efforts (Ikejezie et al., 2022). Ikejezie et al. (2022) studied diphtheria in Haiti, identifying hotspots using spatial analysis and finding associations with health facility density and urbanization. Fariza et al. (2021) developed a methodology to assess diphtheria vulnerability in East Java, Indonesia, using analytical hierarchy process and spatial visualization. Liu et al. (2014) analyzed dengue fever in Guangdong Province, China, using spatial techniques to identify high-risk areas. Manepalli (2011) compared hotspot identification methods, showing effectiveness in risk assessment using spatial analysis.
Spatial analysis aids in understanding disease patterns and informing intervention strategies (Ikejezie et al., 2022). Ikejezie et al. (2022) highlight the importance of identifying hotspots and targeting response efforts. Fariza et al. (2021) demonstrates the utility of spatial visualization in assessing vulnerability to diphtheria. Liu et al. (2014) showcase the value of spatial techniques in identifying high-risk areas for dengue fever. Additionally, Manepalli (2011) illustrates the effectiveness of spatial analysis in hotspot identification. Beyond identifying high-risk areas, spatial analysis can also be used to assess the effectiveness of prevention strategies (Fariza et al., 2021) Spatial analysis also plays a role in post-outbreak surveillance (Tandirogang, 2019). Real-time transmission models can predict the course of a diphtheria outbreak which allowed for proactive resource allocation and more effective control efforts (Finger et al., 2019). Spatial analysis can reveal connections between diphtheria and other health issues (Haeuser et al., 2023). Vitianingsih et al. (2019) ascertain that spatial analysis model is a valuable tool for public health officials to identify areas that require targeted interventions. The importance of robust disease surveillance is highlighted by Phalkey et al. (2013) emphasizes the need for close monitoring of disease trends and emerging drug resistance. Spatial analysis, coupled with robust surveillance, can provide valuable insights for outbreak response (Phalkey et al. 2013). Setiawan et al. (2021) found a correlation between increased vaccination coverage and reduced diphtheria incidence.
These studies collectively emphasize the significance of spatial analysis in disease epidemiology (Ikejezie et al., 2022; Fariza et al., 2021; Liu et al., 2014; Manepalli, 2011) yet none has specifically focused on geospatial mapping of diphtheria, specifically in the study area. This research endeavors to fill this gap by leveraging geospatial techniques spatially analyze response initiative to diphtheria outbreak in Ojo Local Government Area (LGA) of Lagos State.
Material And Methods
Study Area
Ojo Local Government Area having coordinate of latitude 6°22′32″N and 6°34′13″N and Longitude 3°04′12″E and 3°13′23″E and average elevation of 144m above mean sea level, is situated in the western part of Lagos State with area of 70 sq mi (172.71 km2) and population of 901,800. It is known for its proximity to water bodies such as the Lagos Lagoon and the Badagry Creek. Ojo is home to several educational institutions, including the Lagos State University (LASU). The primary occupation in Ojo LGA spans a diverse range of activities, including trade, commerce, agriculture, and various skilled and unskilled professions. The area hosts markets, industrial zones, and educational institutions, reflecting a dynamic economic landscape. Major markets including Alaba International Market, Alaba livestock market (Alaba Rago), the old Lagos International Trade Fair complex, and Iyana-Iba market.
In terms of precipitation, Ojo experiences the typical tropical climate prevalent in the region, characterized by distinct wet and dry seasons. The rainy season usually spans from April to October, influencing agricultural practices and water resource management within the LGA.
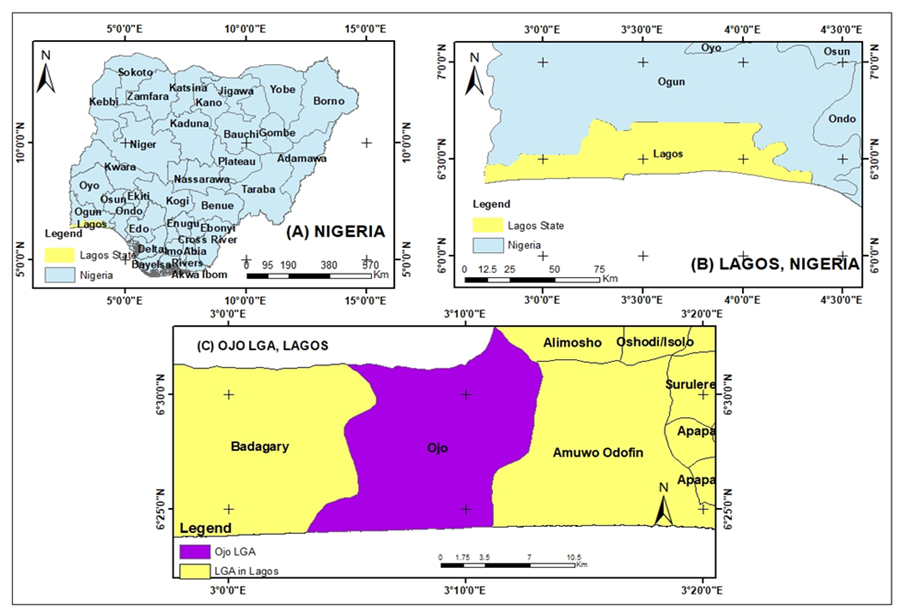
Fig 1: Study Area
Data Collection and Processing
The flowchart of the research methodology is as shown in Figure II
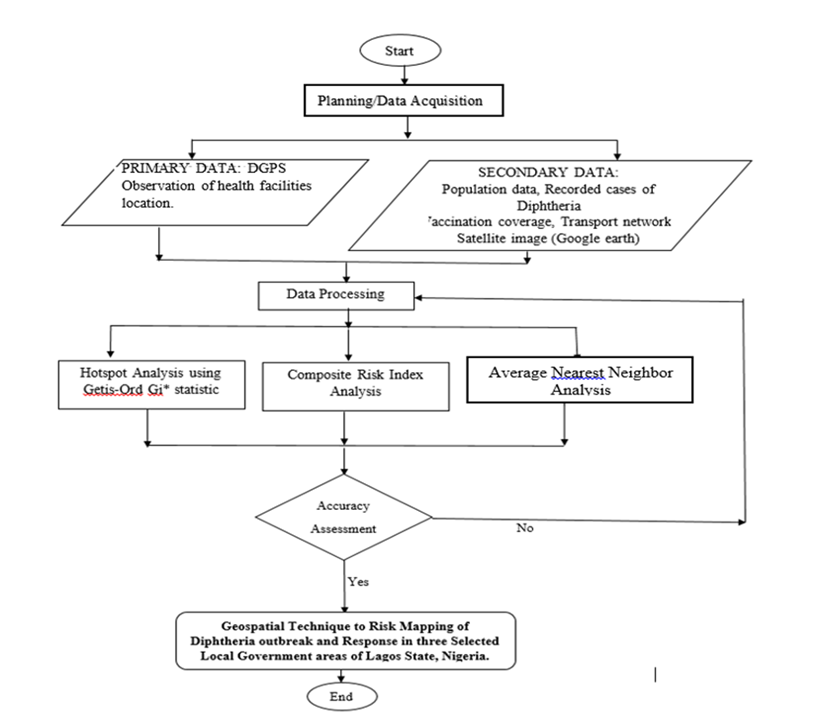
Fig 2: Framework of the Research Methodology.
The study commenced with planning and data acquisition. Data acquisition consist of primary and secondary data. The primary data include the coordinates of health care facilities where diphtheria was recorded. The secondary data include boundary of political wards in Ojo Local Government Areas (LGA), recorded cases of diphtheria, population data, vaccination coverage and transportation network. The primary data obtained in the course of this research are locational data of health facilities where diphtheria cases are being tested and treated. This was possible with the use of two units of Sino GNSS receivers (ComNAVT30) in Real-Time Kinematic (RTK) Mode for acquisition of data. This study utilized the data of recorded Diphtheria cases which aid in obtaining the spatial pattern of diphtheria outbreak in the study area. The population data was obtained from the National Population Commission and it is displayed in the table 1.
Table 1: Population density of Ojo LGAs
| LGA | population | Land mass in Sq.Km | Population Density |
| Ojo | 901,800 | 172.71 | 5221 |
Vaccination coverage was obtained from the Ministry of Health and transportation network of the study area was downloaded online from Geofabrik website. Average Nearest Neighbor (ANN) analysis was carried out on ArcMap to obtain the spatial distribution of the disease in the study area. Hotspot mapping was carried out using spatial statistical techniques (Getis-Ord Gi*statistic) on the ArcMap software to identify clusters or areas with a significantly higher number of diphtheria cases. Based on relative importance, weight was assigned to selected indicators (population density, proximity to healthcare facilities, vaccination coverage rates, and transportation network) and standardized using weighted overlay analysis on the ArcMap software. Then a Composite Risk Index (CRI) was obtained using Analytic Hierarchical Process (AHP). The classification of the hotspot analysis was grouped into five (5) according to Ohana-levi et al., (2019) and Ben-Gal et al., (2021) and it is shown in table 2:
Table 2: Hotspot classification
Source: (Ohana-Levi et al, 2019 and Ben-Gal et al, 2021).
| S/N | Z-score | Classification |
| 1 | -2.57 - -1.96 | Very low |
| 2 | -1.95 - -1.94 | Low |
| 3 | -1.63 – 1.64 | Moderate |
| 4 | 1.65 – 1.96 | High |
| 5 | 1.97 – 2.58 | Very high |
To ensure that the spatial data obtained is fit for use and for the purpose of this research, Differential Global Positioning System (DGPS) unit were used and necessary precautions were taken. Also ground-truthing operation was carried out on some of the secondary data obtained.
Result And Discussion
The result’s analysis is categorized into three sections: Spatial distribution pattern, Hotspot analysis, and Composite risk index mapping.
Spatial Distribution of Pattern of the Spread of Diphtheria Outbreak in Ojo LGAs
The spatial distribution of the spread of diphtheria disease in the study area was analyzed using Average Nearest Neigbour (ANN) tool to characterize the distribution pattern of the outbreak. Nearest Neighborhood analysis (ANN) was adopted in determining the pattern of the distribution. Table II and Figure II shows distribution pattern of the spread of the disease. The ANN ratio value for the study is 1,312014 while z-score was 2.311802. Also, the p-value was 0.020789. this indicated a disperse distribution which indicate the spread of the disease. Hence, a dispersed pattern suggests the disease might be spreading slower compared to a clustered scenario. Also, the dispersion could represent the early stages of an outbreak, where cases haven't had enough time to form clusters. However, this dispersion also makes it harder to efficiently allocate resources for control measures like vaccination campaigns. Effective Interventions, Vaccination campaigns or improved sanitation practices might have prevented tight clusters from forming and led to a wider spread of cases. This enhances the World Health Organization’s (2017) research on the prevention and control of diphtheria epidemics through vaccinations.
Table 2: Summary report of nearest neighborhood analysis of Ojo LGAs
| Ojo LGA | |
| Observed Mean Distance (m) | 633.4892 |
| Expected Mean Distance (m) | 482.8373 |
| Nearest Neighbor Ratio: | 1.312014 |
| z-score: | 2.311802 |
| p-value: | 0.020789 |
| Distance Method: | Euclidean |
| Spatial Distribution | Dispersed |
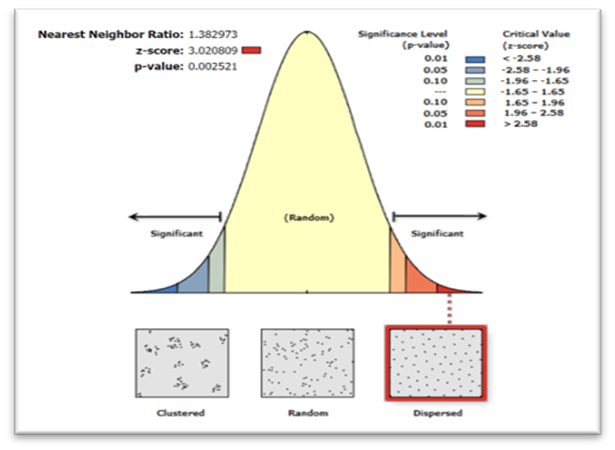
Fig II: Average Nearest Neighbor for Ojo LGAs
Hotspot Analysis
Figure III illustrates the distribution of diphtheria in Ojo Local Government Areas (LGA) within Lagos state, Nigeria. The color-coded representation signifies the severity of the outbreak, specifically very low regions are indicated in light blue color, low region is shown in green color, moderate are in yellow, and high regions are represented in orange and the very high regions are in red color.
The map revealed that diphtheria cases in Ojo LGAs were highly concentrated. Two of the wards identified are Ijegun and Akesan obadore. These wards were characterized by high population density and inadequate sanitation infrastructure that contribute to the heightened spread of the disease (Olulaja et al, 2023). In addition, pocket of low and moderate diphtheria cases were discernable in other regions of Lagos State, particularly in Ojo Local Government Areas (LGAs) such as Oyo Town, Okokomaiko, Ajangbadi, Ijanikin, Iba, Ilogbo, Irewe, Tafi, Etegbin, Idoluwo, and Sabo.
Mitigating the impact of diphtheria in these high-risk areas requires a multifaceted approach improving vaccination coverage, especially in vulnerable regions such as Ojo Local Government Area, is essential (Olulaja et al, 2023). Also, strengthening sanitation infrastructure, encompassing initiatives for waste management and water sanitation, is crucial for reducing disease transmission (Ikejezie et al., 2023). Furthermore, public health campaigns aimed at educating the population about the significance of hygiene practices and early symptom detection can contribute to disease prevention (Wakefield, Loken & Hornik, 2010).
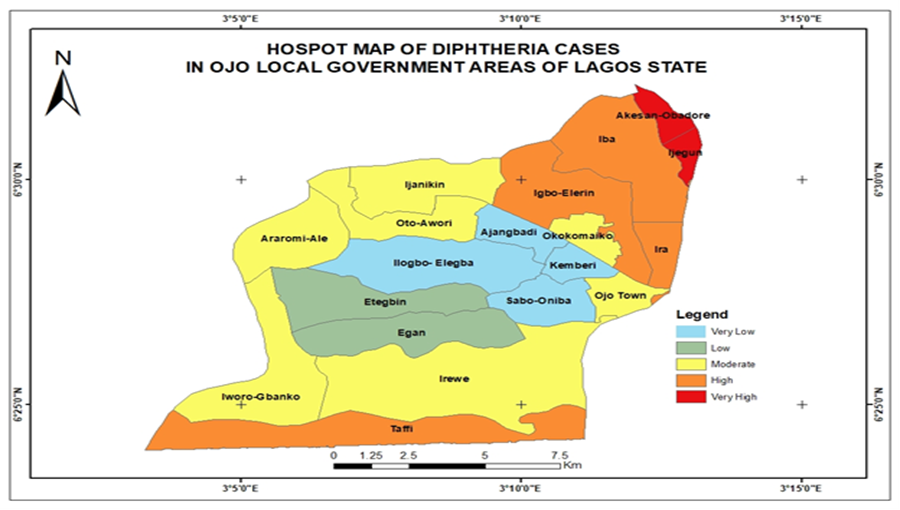
Fig 3: Hotspot Map of Ojo Local Government Area of Lagos state
Composite Risk Index Mapping
I. Analytic Hierarchy Process steps:
- Identified criteria (Population Density, Vaccination Coverage, Proximity to Health Facility, Transport Network).
- Conduct pairwise comparisons to establish criteria preferences using a 1-9 scale as shown in Table III
Table 3: Pairwise Matrix
Source: Author’s (2023)
| Criteria Preferences | POPULATION DENSITY | VACCINATION COVERAGE | PROXIMITY TO HEALTH FACILITY | TRANSPORT NETWORK |
| POPULATION DENSITY | 1 | 1/3 | 1/7 | 1/9 |
| VACCINATION COVERAGE | 3 | 1 | 1/3 | 1/5 |
| PROXIMITY TO HEALTH FACILITY | 7 | 3 | 1 | 1/3 |
| TRANSPORT NETWORK | 9 | 5 | 3 | 1 |
CI: 0,0292 CR: 0,0328 λ: 4,0876
- Calculate weights for criteria based on the Analytic Hierarchy Process see Table 4
Table 4: Weight for criteria
| POPULATION DENSITY | OJO |
| OJO | 1 |
| CI: 0,0323 CR: 0,0622 λ: 3,0647 | |
| VACCINATION COVERAGE | OJO |
| OJO | 1 |
| CI: 0,0472 CR: 0,0908 λ: 3,0944 | |
| PROXIMITY TO HEALTH FACILITY | OJO |
| OJO | 1 |
| CI: 0,0428 CR: 0,0824 λ: 3,0857 | |
| TRANSPORT NETWORK | OJO |
| OJO | 1 |
- Check consistency using the Consistency Ratio (CR = 0.0328).
The consistency ratio (CR) measures the consistency of judgments made in the pairwise comparisons.
Matrices have a CR of less than 0.1, indicating acceptable consistency in the judgments. This suggests that the pairwise comparisons are reliable and consistent.
- Apply criteria preferences to evaluate alternatives (OJO). See Table 5
Table 5: Criteria Preference Calculation. Source: Author (2023)
| CRITERIA PREFERENCES | POPULATION DENSITY | VACCINATION COVERAGE | PROXIMITY TO HEALTH FACILITY | TRANSPORT NETWORK |
| OJO | 0,6491 | 0,6348 | 0,6267 | 0,1998 |
- Rank alternatives based on weighted criteria, revealed that Population Density is the most crucial factor as seen in Table 6
Table 6: Ranking of alternatives
| RANKING | Result |
| TRANSPORT NETWORK | 0,0451 |
| VACCINATION COVERAGE | 0,1102 |
| PROXIMITY TO HEALTH FACILITY | 0,2712 |
| POPULATION DENSITY | 0,5735 |
- Conclude that diphtheria susceptibility is influenced most by Population Density, followed by Proximity to Health Facility, Vaccination Coverage, and Transport Network.
The criteria preferences matrix shows the relative importance of each criterion compared to others.
Transport network has the lowest weight (0.0451), while Population density has the highest weight (0.5735). This suggests that population density is considered the most important factor in determining susceptibility to diphtheria outbreaks.
Vaccination coverage (0.1102) and proximity to health facility (0.2712) are assigned moderate weights, indicating their importance in influencing the risk of outbreaks.
Based on this analysis, the study suggests that diphtheria as a respiratory disease that can spread through respiratory droplets, which can be transmitted in crowded areas.
- Validated findings and presented recommendations for managing diphtheria risk in different areas as seen in Table 7
Table 7: Ranking of Local Governments Area
| Alternatives rankings | Population density | Vaccination coverage | Proximity to health facility | Transport network | Result |
| OJO | 0,0293 | 0,0700 | 0,1700 | 0,1146 | 0,3838 |
Consistency Ratio (CR): 0,0386
The AHP table ranks Ojo LGA based on criteria such as Population Density, Vaccination Coverage, Proximity to Health Facility, and Transport Network. Ojo LGA has a score of (0.3838), this could be due to factors like higher vaccination coverage and greater distance from known hotspots.
According to Figure IV, in Ojo LGA, Iba ward was identified as the only moderate risk ward in the northern region of the LGA. Other wards in the LGA with moderate to high risk include Taffi, Irewe, Iworo-Gbanko, and Iba ward as interventions should focus on addressing unique local context and community-specific factors impacting disease transmission. Low-risk wards include Ojo Town, Okokomaiko, Ajangbadi, Ijanikin, Iba, Ilogbo, Tafi, Etegbin, Idoluwo, Sabo, and Ijanikin. Maintaining high vaccination coverage, supporting continuous improvement in hygiene practices, and ensuring continuous access to healthcare facilities should be prioritised (WHO, 2017; Orenstein et al., 2004).
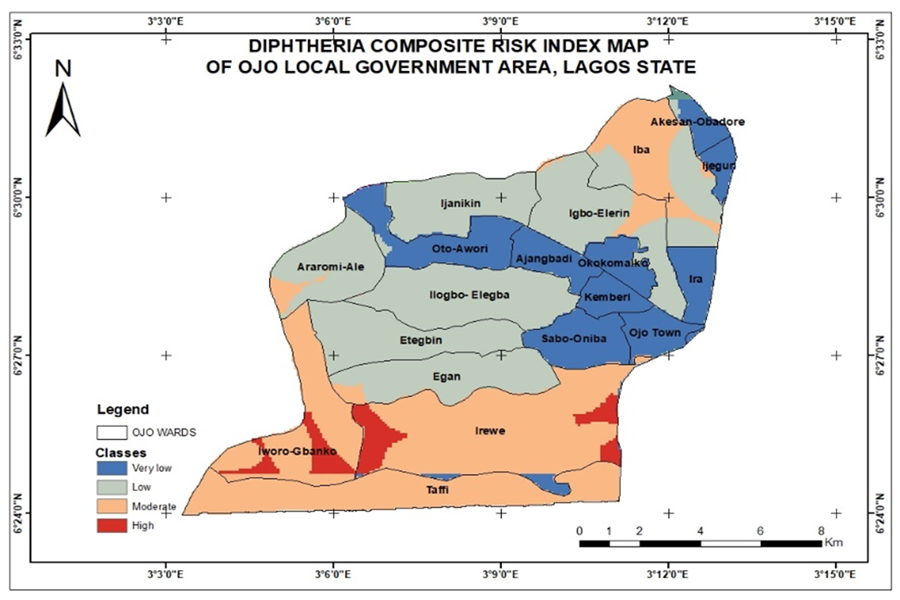
Fig 4:Composite Risk index Map of Ojo LGA
Conclusion
This research has met its aims, giving significant insights into the factors impacting diphtheria spread and evidence-based recommendations for targeted public health actions.
From the spatial distribution pattern of diphtheria, the area that required rapid attention and intervention were determined. The findings validated the importance of prompt attention and action in the identified hotspots, emphasizing the importance of targeted treatments in areas with higher concentrations of diphtheria cases. The Composite risk assessment revealed differences in vulnerability levels across areas in Ojo LGAs. Irewe and Iworo-Gbanko wards recorded the highest. Population density was found to be an important factor in influencing vulnerability to diphtheria outbreaks, correlating with prior study (Ganasegeran, et al, 2021; Neiderud, 2015).
Recommendation
Therefore, this research is recommended to the relevant authorities for careful observation and analysis which will guide towards tailored and targeted responses to the spread of disease. Also, targeted interventions, such as greater vaccination coverage, improved sanitation infrastructure, and improved healthcare accessible, are required in the identified high-risk locations. The study's thorough approach to spatial analysis, statistical analysis, and risk assessment lays a solid platform for public health planning and intervention measures in the fight against diphtheria outbreaks
Acknowledgement
This research owes a great debt of gratitude to Dr. V.A Ijaware for conception of the research idea, his meticulous supervision, insightful manuscript review, and invaluable feedback. His guidance was instrumental in shaping this work. I would also like to extend my appreciation to Mr. Asaju and Mrs. Ifeoluwa for their invaluable assistance. Their contributions significantly aided in the research structure.
Finally, I acknowledge the crucial role of the Federal University of Technology Akure, Nigeria, in providing the resources and facilities necessary for this research to be completed.
References
- Abdulrasheed, N., Lawal, L., Mogaji, A. B., Abdulkareem, A. O., Shuaib, A. K., Adeoti, S. G., ... & Abdul‐Rahman, T. (2023). Recurrent diphtheria outbreaks in Nigeria: A review of the underlying factors and remedies. Immunity, Inflammation and Disease, 11(11), e1096.
- Ohana-Levi, N., Ben-Gal, A., Peeters, A., Termin, D., Linker, R., Baram, S., ... & Paz-Kagan, T. (2021). A comparison between spatial clustering models for determining N-fertilization management zones in orchards. Precision Agriculture, 22, 99-123.
- Besa, N. C., Coldiron, M. E., Bakri, A., Raji, A., Nsuami, M. J., Rousseau, C., ... & Porten, K. (2014). Diphtheria outbreak with high mortality in northeastern Nigeria. Epidemiology & Infection, 142(4), 797-802.
- Church, D. L. (2004). Major factors affecting the emergence and re-emergence of infectious diseases. Clinics in laboratory medicine, 24(3), 559-586.
- Dikid, T., Jain, S. K., Sharma, A., Kumar, A., & Narain, J. P. (2013). Emerging & re-emerging infections in India: an overview. Indian Journal of Medical Research, 138(1), 19-31.
- Fariza, A., Basofi, A., & Aryani, M. D. (2021, February). Spatial mapping of diphtheria vulnerability level in East Java, Indonesia, using analytical hierarchy process–natural break classification. In Journal of Physics: Conference Series (Vol. 1803, No. 1, p. 012009). IOP Publishing.
- Fariza, A., Jalilah, H., Muarifin, & Basofi, A. (2021). Spatial Mapping and Prediction of Diphtheria Risk in Surabaya, Indonesia, Using the Hierarchical Clustering Algorithm. In Proceedings of the 1st International Conference on Electronics, Biomedical Engineering, and Health Informatics: ICEBEHI 2020, 8-9 October, Surabaya, Indonesia (pp. 251-268). Springer Singapore.
- Finger, F., Funk, S., White, K., Siddiqui, M. R., Edmunds, W. J., & Kucharski, A. J. (2019). Real-time analysis of the diphtheria outbreak in forcibly displaced Myanmar nationals in Bangladesh. BMC medicine, 17, 1-11.
- Ganasegeran, K., Jamil, M. F. A., Ch’ng, A. S. H., Looi, I., & Peariasamy, K. M. (2021). Influence of population density for COVID-19 spread in Malaysia: an ecological study. International journal of environmental research and public health, 18(18), 9866.
- Haeuser, E., Nguyen, J. Q., Rolfe, S., Nesbit, O., Fullman, N., & Mosser, J. F. (2023). Assessing Geographic Overlap between Zero-Dose Diphtheria–Tetanus–Pertussis Vaccination Prevalence and Other Health Indicators. Vaccines, 11(4), 802.
- Ikejezie, J., Adebusoye, B., Ekezie, W., Langley, T., Lewis, S., & Phalkey, R. (2023). Modifiable risk factors for diphtheria: a systematic review and meta-analysis. Global Epidemiology, 5, 100100.
- Ikejezie, J., Langley, T., Lewis, S., Bisanzio, D., & Phalkey, R. (2022). The epidemiology of diphtheria in Haiti, December 2014–June 2021: A spatial modeling analysis. Plos one, 17(8), e0273398.
- Liu, C., Liu, Q., Lin, H., Xin, B., & Nie, J. (2014). Spatial analysis of dengue fever in Guangdong Province, China, 2001-2006. Asia Pacific Journal of Public Health, 26(1), 58-66.
- Lodeiro-Colatosti, A., Reischl, U., Holzmann, T., Hernández-Pereira, C. E., Rísquez, A., & Paniz-Mondolfi, A. E. (2018). Diphtheria outbreak in amerindian communities, Wonken, Venezuela, 2016–2017. Emerging Infectious Diseases, 24(7), 1340.
- Manepalli, U. R., Bham, G. H., & Kandada, S. (2011, September). Evaluation of hotspots identification using kernel density estimation (K) and Getis-Ord (Gi*) on I-630. In 3rd International Conference on Road Safety and Simulation (Vol. 21, pp. 14-16). Indianapolis Indiana, United States: National Academy of Sciences.
- Medugu, N., Musa-Booth, T. O., Adegboro, B., Onipede, A. O., Babazhitsu, M., & Amaza, R. (2023). A review of the current diphtheria outbreaks. African Journal of Clinical and Experimental Microbiology, 24(2), 120-129.
- Neiderud, C. J. (2015). How urbanization affects the epidemiology of emerging infectious diseases. Infection ecology & epidemiology, 5(1), 27060.
- 18. Nigeria Center for Disease Control (2023). DIPHTHERIA. https://www.google.com/url?sa=tandrct=jandq=andesrc=sandsource=webandcd=andved=2ahUKEwii-
- Obansa, S. A. J., & Orimisan, A. (2013). Health care financing in Nigeria: prospects and challenges. Mediterranean Journal of social sciences, 4(1), 221-236.
- Ohana-Levi, N., Bahat, I., Peeters, A., Shtein, A., Netzer, Y., Cohen, Y., & Ben-Gal, A. (2019). A weighted multivariate spatial clustering model to determine irrigation management zones. Computers and Electronics in Agriculture, 162, 719-731.
- Olulaja, O. N., Anjorin, E. T., Ekerin, O., Afolabi, O. T., & Inuojo, J. M. (2023). A looming epidemic: combating the recurrent outbreaks of diphtheria in Nigeria. The Pan African Medical Journal, 45.
- Wharton, M. E. (2004). Measles elimination in the United States. The Journal of Infectious Diseases, 189(Supplement_1), S1-S3.
- Phalkey, R. K., Bhosale, R. V., Joshi, A. P., Wakchoure, S. S., Tambe, M. P., Awate, P., & Marx, M. (2013). Preventing the preventable through effective surveillance: the case of diphtheria in a rural district of Maharashtra, India. BMC Public Health, 13, 1-10.
- Setiawan, A., Hendrati, L. Y., & Mirasa, Y. A. (2021). THE MAPPING AND ANALYSIS OF DIPHTHERIA CASES IN SURABAYA. Jurnal Biometrika dan Kependudukan, 10(1), 45-52.
- Tandirogang N, Pratama G P D , Yuniati, Fikriah I, Abrizal V, Bulan D E, Yadi (2019) Spatial Analysis in Polymerase Chain Reaction for Detection of Corynebacterium diphtheriae Post-outbreak in Samarinda. Proceedings of the 10th International Seminar and 12th Congress of Indonesian Society for Microbiology (ISISM 2019) Advances in Biological Sciences Research. ISBN10.2991/absr.k.210810.037. ISSN 2468-5747.
- Truelove, S. A., Keegan, L. T., Moss, W. J., Chaisson, L. H., Macher, E., Azman, A. S., & Lessler, J. (2020). Clinical and epidemiological aspects of diphtheria: a systematic review and pooled analysis. Clinical Infectious Diseases, 71(1), 89-97.
- Van Seventer, J. M., & Hochberg, N. S. (2017). Principles of infectious diseases: transmission, diagnosis, prevention, and control. International encyclopedia of public health, 22.
- Vitianingsih, A., Choiron, A., Cahyono, D., & Suyanto, S. (2019, September). Weighted Sum Model for Spatial Analysis in Classification of Areas Prone to Diphtheria Tetanus. In Proceedings of the 1st Asian Conference on Humanities, Industry, and Technology for Society, ACHITS 2019, 30-31 July 2019, Surabaya, Indonesia.
- Wakefield, M. A., Loken, B., & Hornik, R. C. (2010). Use of mass media campaigns to change health behaviour. The lancet, 376(9748), 1261-1271.
- WHO. (2017). Diphtheria vaccine: WHO position paper - August 2017. World Health Organization. https://www.who.int/wer/2017/wer9229/en/. Retrieved on December 23, 2023.


