Archive : Article / Volume 1, Issue 1
Case Report | DOI: https://doi.org/10.58489/2836-8630/003
A Generational Study on Vitmamin D Status of Selected Type 2 Diabetics
1 Department of Nutrition & Dietetics, PSG College of Arts & Science, Coimbatore, TN, India
Correspondng Author: Jemima Beryl Mohankumar
Citation: Jemima Beryl Mohan Kumar, Bhavani S., A Generational Study on Vitmamin D Status of Selected Type 2 Diabetics.Journal of Clinical Pediatrics and Care. 1(1). DOI: 10.58489/2836-8630/003
Copyright: © 2023 Jemima Beryl Mohan Kumar, this is an open access article distributed under the Creative Commons Attribution License, which permits unrestricted use, distribution, and reproduction in any medium, provided the original work is properly cited.
Received Date: 2023-01-15, Received Date: 2023-01-15, Published Date: 2023-01-31
Abstract Keywords: T2DM; Vitamin D Status; generations; VDDRS; serum Vitamin D
Abstract
Introduction: There is a rising surge of T2DM and hypo-vitaminosis D among Indians. The main role of vitamin D in bone metabolism is to increase the plasma levels of calcium and phosphorus, essential for mineralization. Mineralization is a passive process, but it only occurs when calcium and vitamin D are available in sufficient quantities. Vitamin D plays important roles in the metabolism of glucose. It directly stimulates insulin secretion from beta cells of pancreas. It increases intracellular calcium levels which attenuates insulin synthesis.
Method: Therefore, we aimed to study the vitamin D status and bone health between diabetic and non-diabetic off-springs (GII & GIII) of the selected diabetics (GI). We conducted a cross-sectional study over three generations to assess their vitamin D status and bone health. The tools included the online vitamin D estimator and serum vitamin D levels.
Results: The correlation study shows that the parameters of the VDDRS are positively correlated to serum Vitamin D levels. However, the degree to which they were positively correlated varies greatly. Day frequency and dense fabric clothing were very strongly correlated. The serum VD levels of the diabetic and non-diabetics GII participants were significantly different both among the males and females (pâ¤0.05).
Conclusion: Since vitamin D has such a vast role in health particularly in the case of T2DM, we recommend that VDDRS may use in routine screening and assessment of T2DM for appropriate treatment.
Introduction
Several etiological factors including genetic, environmental, lifestyle and nutritional have been implicated in the causation of T2DM. One of the important emerging nutritional risk factors recognized for the development of insulin resistance (IR) and T2DM is deficiency of vitamin D. Also it has been proposed to be associated with worsening of glycemic control and progression of complications among T2DM individuals (Pittas & Dawson-Hughes, 2010) [1]. In spite of adequate sunlight exposure throughout year, several studies have documented deficiency of vitamin D as most prevalent findings among Indians (Ritu & Ajay, 2014)[2]. There is a rising surge of T2DM and hypo-vitaminosis D among Indians. The relation between vitamin D and T2DM in recent studies published from India have been reviewed by Asegaonkar (2016).
Heredity and Type 2 Diabetes
Although the non-genetic factors play a major role in the development of Type 2 diabetes, even with the same exposure, the susceptibility to the disease will vary between individuals which make it possible for researchers to conclude that the disease is as a result of heredity as well. Heredity has all along been mentioned to play an important role in the development of diabetes but it was until four decades ago (in the 1980s) that genetic variants started to be identified to back up these heredity claims after the advancement of human genetic studies and the coming in of modern genetic technologies (Ali, 2013; McCarthy & Zeggini, 2009) [3&4]. Candidate gene studies were the ancient studies used in identifying genes that are associated with Type 2 diabetes before the coming of genome wide linkage and genome wide association studies but only a few genes and variants were identified (Song, et al., 2004) [5].
The genetic basis of this disease is most intriguing as this exerts the most pressure when it comes to the population at risk - the cohort being the South-East Asian population, with India at the forefront. To date, there are three known epigenetic mechanisms of endocrine disruption: DNA methylation, histone modification, and aberrant miRNA expression. These mechanisms have myriad effects on human development, health, and reproduction. Epigenetic modifications do not alter the gene sequence; however, they can alter gene [removed]Jirtle & Skinner, 2007) [6]. Epigenetic changes are heritable (Zhang & Ho, 2011) [7] during cell division (Feinberg, 2007)[8] and reversible based on environmental signals (Gabory et al., 2011) [9].
Vitamin D and Diabetes
The main role of vitamin D in bone metabolism is to increase the plasma levels of calcium and phosphorus, essential for mineralization. The increase in circulating levels of calcium is also necessary for the proper functioning of nerve transmission, neuromuscular junctions and hormone secretion, in particular PTH (Lips & Schoor, 2011) [10]. All these mechanisms increase bone mineral density and reduce the risk of falling by increasing muscle tone, which contributes to reducing osteoporosis and its consequences.
Clinical study interpretation is difficult because of variability in dosage, dosage form, study duration, and populations studied, as well as recently reported normal human polymorphisms in vitamin D synthesis and catabolism, vitamin D-binding protein, and vitamin D receptors in addition to a host of potential epigenetic confounders. Low vitamin D status appears to be associated with type 2 diabetes and most other insulin resistance disorders reported to date (Sacerdote, et al., 2019) [11].
Methods and Materials
The study was conducted at the out-patient facility of the Endocrinology Department of PSG Institute of Medical Sciences & Research, Peelamedu, Coimbatore, India, which has an Institutional Human Ethics Committee. The ICMR (2006) [12] guidelines were followed to protect the rights of the study participants. Ethical Clearance (15/328, dated 04/12/2015 was obtained from PSG Institute of Medical Sciences and Research Hospitals, Coimbatore, Tamil Nadu, India. The purpose of study was explained by the researcher to the participants and their consent was obtained in the ICMR human ethics consent form.
Sample size was calculated using the online facility www.http//surveysystem.com by using data on current adult population of Coimbatore, number of type 2 diabetics, prevalence rate and 95% confidence level. The study participants were selected on the bases of inclusion viz. all the participants were the children of type 2 diabetics.
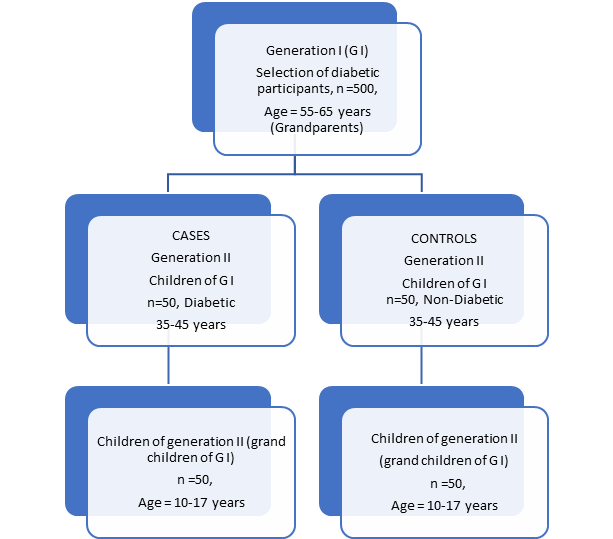
We selected 500 generation I (GI) in the age group of 55-65years. They were both male and female diabetic (≤ 5 years). Baseline data were collected from all the selected participants. For the in-depth study on vitamin D status 50 diabetic and non-diabetic off-springs each of the GI participants in the age group of 35-45 years were selected by purposive sampling. They are denoted as GII. The next generation participants (GIII) were the children of the GII participants. Those of the GI participants who were excluded were those with Sarcoidosis, kidney diseases, Systemic disease, Early menopause, HRT, usage of medicines for corticosteroids, diuretics, blood pressure and persons with Hypothyroid, hyperthyroid, Cushing syndrome, primary hyperparathyroidism, renal failure, liver disease, inflammatory bowel disease, malabsorption syndrome, alcoholism, osteoporotic breakage history and scoliosis.
The study design
Our study was a cross-sectional observational study, as the study participants were in a non-controlled environment without the researchers actually interfering or manipulating with other aspects of life and therefore is non-experimental. The observations were current and at a specified point of time. We can further describe our study design as a case-control study as we tried to determine the degree of associations of the selected parameters between diabetic and non-diabetic. Typically, we identified appropriate representative controls for the cases that we were studying (Munnangi & Boktor, 2020) [13]. The Figure 1 shows the overall sample design explicitly. The generation I participants were all diabetic, but some had off-springs who were not diabetic.
To embark on our research, we set forth the hypothesis that there is no difference in the relationship of the VDDRS and Serum VD levels of the diabetic and non-diabetic participants of each of the generations.
For data collection pertaining to the Assessment of Vitamin D Status and Bone Health we used the following three tools. i. The online Vitamin D Estimator; ii. Serum Vitamin D iii. Bone mineral density (BMD)
- Vitamin D Estimator - Questionnaire
Free downloadable vitamin D Estimator from https://vitamind3-cholecalciferol.com/how-to-estimate-your-vitamin-d-level/ was used in our study. It takes into account age, body mass, sun exposure, skin type and geographic latitude as well as how much Vitamin D is consumed from foods and supplements. The Minimum score = 17; and Maximum score =58. The Interpretation is as follows: -
Score <25>
- Serum Vitamin D
The method used to test the serum Vitamin D was Electro Chemi Luminescent Immuno sorbent Assay (ECLIA). The machine used was the Roche Diagnostics-Cobas E411 from Roche Cobas, German. The assay employs a vitamin D binding protein (VDBP) as capture protein, which binds to both 25-OH D3 and 25-OH D2 (Roche Diagnostics, Mannheim, Germany) (Cobas, accessed 2015). The sum of the concentrations of 25-OH Vitamin D2 and 25-OH Vitamin D3, in serum or plasma, is referred to as “Total 25-OH Vitamin D”. Accurate monitoring of total 25-OH Vitamin D level is critical in clinical settings.
A common definition of vitamin D insufficiency is 25-hydroxyvitamin D <50>, et al., 1997; Lips, 2004; Dawson-Hughes, et al., 2005) [14,15,16]. To establish the categories of Vit D status, the cutoffs proposed by Holick (2017) [17] were used. They were as follows: deficiency was defined as serum 25(OH)D concentration ≤20 ng/mL (50 nmol/L), sufficiency for bone health as 21–29 ng/mL (52.5–72.5 nmol/L), and ≥30 ng/mL (75 nmol/L) as optimal, which is associated with health benefits, although a concentration between 40 and 60 ng/mL (100–150 nmol/L) is preferred. In our study the serum Vitamin D levels were graded as severely deficient; deficient; insufficient; normal and toxic levels.
All the data that were collected were scrutinized and entered in MS Excel sheets. Statistical data analyses were done on SPSS ver 19 under the supervision of a statistician. Descriptive statistics is given as frequency distribution and mean. Correlation analyses were carried out using Pearson’s coefficient and conclusions were drawn of the bases of the p values. BMD data of type 2 diabetic subjects were compared with those without diabetes matched for age using unpaired Student's t-test
Results
Many epidemiological studies have addressed the management of the classical complications of diabetes. The great–and increasing–prevalence of this condition makes it a leading public health problem. However, osteoporosis in type 2 diabetes mellitus (T2DM) is a “silent epidemic”, it being difficult to assess as it causes no symptoms until fracture occurs.
Table 1 – Distribution of the participants from the three generations based on their serum vitamin D levels
*Serum Vit D Levels | Classification of Vit D status | G1D | G1ND | G2D | G2ND | G3D | G3ND | Total (percent) |
≤15 | Severely deficient | 15 | 12 | 11 | 1 | 2 | 0 | 41 (17.3) |
| 15-20 | Deficient | 22 | 20 | 16 | 13 | 17 | 2 | 90 (38) |
21-29 | Insufficient | 1 | 2 | 14 | 19 | 16 | 30 | 82 (34.6) |
≥30 | Normal | 4 | 3 | 1 | 4 | 7 | 5 | 24 (10.1) |
Total | Total | 42 | 37 | 42 | 37 | 42 | 37 | 237 |
* Holick, 2006 & Bischoff-Ferrari, et al., 2006
Since this article is entirely devoted to serum vitamin D levels and bone mineral density, we are not presenting the demographic details of the selected participants. We present the distribution of the participants based on the serum vitamin D levels in the following table (Table 1). We found that most of the GI participants were either severely deficient or deficient and only 10.1% of all three generations put together had normal serum vitamin D level.
Subramanian, et al., (2011) [18] reported that the concentrations (ng/ml) of serum 25(OH)D3 (mean ± SD) were significantly lower for the T2DM patients than the non-diabetic patients (11.0 ± 7.5 vs 15.5 ± 9.8, p = 0.00). Severe vitamin D deficiency (%) was significantly more prevalent among the T2DM patients than the non-diabetic patients (57.6 vs 33.3, p = 0.001). Vitamin D deficiency and insufficiency (%) was more prevalent among non-diabetic patients than T2DM patients (44.4 vs 28.6 and 14.4 vs 11.9, respectively). The concentration (ng/ml) of serum 25(OH) D3 (mean ± SD) was significantly lower for diabetic males than diabetic females (9.07 ± 6.7 vs 12.6 ± 7.6, p = 0.02, respectively).
Subramanian, et al., (2011) [18] further reported the logistic regression analysis that low concentrations of serum 25(OH)D3 did not emerge as a predictor of T2DM. No significant correlation was seen on simple correlation analysis between concentration of serum 25(OH)D3 and BMI (R2 = 0.004), WC (R2 = 0.0000007), total body fat (R2 = 0.0029), truncal body fat (R2 = 0.0077), FBG (R2 = 0.0238), glycosylated hemoglobin (R2 = 0.0692), systolic blood pressure (R2 = 0.0003), diastolic blood pressure (R2 = 0.0005), triglycerides (R2 = 0.0007) and high-density lipoprotein (R2 = 0.0156) among T2DM patients.
We used the correlation statistical method to assess a possible linear association between VDDRSQ and several continuous variables that are likely to be the factor in causing the deficiency. It is a method of assessing a possible two-way linear association between two continuous variables. It is a dimensionless quantity that takes a value in the range −1 to +1. A correlation coefficient of zero indicates that no linear relationship exists between two continuous variables, and a correlation coefficient of −1 or +1 indicates a perfect linear relationship.
Table 2 Correlation of the Vitamin D Deficiency Risk Score with Serum Vitamin D of the Participants in all three Generations
VDDRSQ | Pearson’s rα | Direction and strength of correlation | p value |
|---|---|---|---|
| Age | 0.506** | Moderately positive | 0.000 |
| BMI | 0.409** | Weakly positive | 0.000 |
| Exposure time | 0.497** | Weakly positive | 0.000 |
| Exposure per day | 0.684** | Moderately positive | 0.000 |
| Skin colour | 0.596** | Moderately positive | 0.000 |
| Day frequency | 0.938** | Very Strongly positive | 0.000 |
| Body surface exposure | 0.740** | Moderately positive | 0.000 |
| Sunscreen cream use | 0.537** | Moderately positive | 0.000 |
| Day clothing type | 0.419** | Weakly positive | 0.000 |
| Dense fabric | 0.859** | Very Strongly positive | 0.000 |
| Fabric colour | 0.580** | Moderately positive | 0.000 |
| Vit D supplements | 0.611** | Moderately positive | 0.000 |
| Milk intake | 0.062 | Negligible positive | 0.344 |
| Fish intake | 0.319** | Weakly positive | 0.000 |
| Overall VDDRS | 0.899** | Very Strongly positive | 0.000 |
Note: ** correlation is significant at the 0.01 level (2-tailed).
Note: αcorrelation coefficient value (r); ** Significant at the 0.01 level (2- tailed)
We found a very strong positive correlation between for day frequency, dense fabric and overall VDDRS. In this analysis the strength of relationship can be anywhere between −1 and +1. The stronger the correlation, the closer the correlation coefficient comes to ±1. If the coefficient is a positive number, the variables are directly related (i.e., as the value of one variable goes up, the value of the other also tends to do so). If, on the other hand, the coefficient is a negative number, the variables are inversely related (i.e., as the value of one variable goes up, the value of the other tends to go down). This statistical analysis has high external validity. Hence, it can be used to confidently generalize the conclusions to other populations or settings (Swinscow, 1997) [19]. The correlation study showed that all the other parameters of the VDDRS were positively correlated to serum Vitamin D levels. However, the degree to which they are positively correlated varied greatly.
The following Tables present the data and statistical analyses to test our hypothesis. The VDDRS were considered in three domains, viz. i) sunlight exposure; ii) sun protection and iii) vitamin D food supplements. Based on the t and p values we arrive at the following conclusions.
The time required to obtain the recommended UV dose for adequate vitamin D3 synthesis in human skin (i.e., 1 Safe vitamin D Dose) depends on the solar elevation angle, as well as the surface and atmospheric conditions. For fixed typical atmospheric conditions, a significant variation with respect to season and latitude is evident. The period and locations at which the recommended UV exposure is not available is not as extensive as the vitamin D3 winter found by Webb et al. (1988) [20] who used realistic exposure times of up to 3 h and not the extensive periods accumulated in the model scenario. In reality, the variability of UVB radiation, and consequently the vitamin D3 effective dose, is immense even at one location, primarily due to variations in cloudiness, ozone, surface reflection and aerosols. The recommended exposure times must account for skin type and changes in the radioactive regime. Roughly speaking, variations in skin type and parameters influencing UV radiation shift the extent of the red and black fields in up and down while the essential shape is preserved (Webb & Engelsen, 2006) [21].
Table 3 Comparison between the means of Serum Vitamin D with VDDRS Category of all the three Generation Category Participants
VDDRS Category | Serum vitamin D Levels (ng/dL) | |||||||||||
|---|---|---|---|---|---|---|---|---|---|---|---|---|
Generation category | ||||||||||||
G1PD | G1PND | G2D | G2ND | G3D | G3ND | |||||||
N | Mean±SD | N | Mean±SD | N | Mean±SD | N | Mean±SD | N | Mean±SD | N | Mean±SD | |
| High risk (≤ 22) | 10 | 7.6±0.8 | 8 | 8.12±0.8 | 3 | 7.33±0.6 | 1 | 7 | 0 | - | 0 | - |
| Medium risk (23 to 30) | 24 | 11.38±2.5 | 21 | 11.57±2.5 | 21 | 13±5.4 | 9 | 18.67±3.5 | 3 | 9.67±2.1 | 1 | 16 |
| Low risk (31 to 39) | 4 | 13.75±3.2 | 6 | 21±8.6 | 17 | 23.41±5.3 | 23 | 22.09±2.7 | 32 | 19.28±5.9 | 31 | 24.65±3.6 |
| No risk (≥ 40) | 4 | 31.75±0.9 | 2 | 31.5±0.7 | 1 | 31 | 4 | 32.75±2.2 | 7 | 33.43±0.8 | 5 | 35.6±2.7 |
| Total | 42 | 12.64±6.9 | 37 | 13.43±7.1 | 42 | 17.24±7.9 | 37 | 22±5.4 | 42 | 20.95±8.0 | 37 | 25.89±5.4 |
The synthesis of vitamin D in the skin occurs in a two-stage process. As soon as the skin is exposed to solar UVB radiation 7-DHC is photolyzed to pre-vitamin D3. After this initial photolysis the pre-vitamin D3 undergoes a temperature and membrane dependent isomerization in the skin to vitamin D3. Latitude, altitude, season, time of the day, ozone amount, cloud amount, aero-sol and reflectivity of the earth’s surface (albedo) are the factors that control the number of UVB photons that reach the earth’s surface. In Tirupati, Andhra Pradesh, India (latitude 13.40° N), the average duration of cloud-free sunshine is 8–10 h/day throughout the year. The UV index at this latitude during the study period was 7–9h/d (Harinarayanan, et al., 2013) [22]
The prevalence of Vitamin D deficiency is reported worldwide, both in sunshine deficient and sunshine sufficient countries. Still, it is the most under-diagnosed and under-treated nutritional deficiency in the world (van Schoor & Lips 2011 & Mithal, et al., 2009) [23&24]. However, various studies showed poor Vitamin D status irrespective of age, sex, and geography. As there is no standard guideline which is followed all over the world for classifying the Vitamin D status, these studies had different cutoff values for the deficiency. The vast majority of these studies used serum 25(OH) D level of <20>
Skin complexion, poor sun exposure among indoor workers and vegetarian food explains the VDD among indoors despite sunny climate (Saha, et al., 2018; Goswami, et al., 2017) [26 & 27]. Calcium intake, crucial for bone health, is also deficient by upto 30 per cent in urban and tribal areas (Harinarayan & Akhila, 2019) [28].
Initial observational studies indicated an inverse correlation between serum vitamin D status and prevalence of diabetes, and also a possible association between poor vitamin D status and increased progression from pre-diabetes to diabetes. The worsening of glycaemic control in diabetic patients during winter was also attributed to lowering of vitamin D levels during those months. Till recently, these notions were driving clinicians to consider routine supplementation of vitamin D to patients with diabetes mellitus. In urban Indian men, >1 h of casual midday sunlight exposure daily was required to maintain serum 25(OH)D concentrations above 50 nmol/L, and >2 h of casual sunlight exposure was needed to maintain 25(OH)D concentrations above 75 nmol/L. Excess sunlight did not increase 25(OH)D linearly. The sunlight exposure questionnaire was validated for use in clinical studies and surveys (Patwardhan, et al., 2018) [29].
Conclusion
The results indicate that there was no significant difference in the VDDRS between diabetic and non-diabetic group. That is, the mean score of diabetics and non-diabetics (GIPD 27.31±5.29 &GIPND 27.41±5.20; GIID 29.45±4.83 & GIIND 32.32±4.22; GGIIID 34.81±3.79 & GIIIND 35.32±3.22) was not significantly different. Therefore, we accept the null hypothesis and conclude that the VDDRS is not different in the diabetic and non-diabetic groups. In all the three generations the VDDRS increased as the serum level of VD increases. The Pearson’s correlation showed a positive relationship. The correlation study shows that the parameters of the VDDRS are positively correlated to serum Vitamin D levels. However, the degree to which they were positively correlated varies greatly. Day frequency and dense fabric clothing were very strongly correlated. The serum VD levels of the diabetic and non-diabetics GII participants were significantly different both among the males and females (p≤0.05).
The metabolic changes in type 2 diabetes are highly complex and influenced by several micronutrients of which the role of vitamin D has been well established. Vitamin D status is influenced by both modifiable and non-modifiable factors. It has been noted of late that the modifiable factors like diet, clothing and exposure to sunlight are causing a negative impact on vitamin D status. We recommend that the VDDRS card be used in public health programmes to give an early warning of the dire outcomes of vitamin D deficiency. Our suggestion is valid because T2DM is already endemic in the country and vitamin D deficiency will lead to a greater calamity.
References
- Pittas, A. G., Sun, Q., Manson, J. E., Dawson-Hughes, B., & Hu, F. B. (2010). Plasma 25-hydroxyvitamin D concentration and risk of incident type 2 diabetes in women. Diabetes care,33(9), 2021-2023.
- Ritu G. & Gupta A., (2014), Vitamin D deficiency in India: prevalence, causalities and interventions, Review- Nutrients, 2014 Feb 21;6(2):729-75.
- Ali, O. (2013). Genetics of type 2 diabetes. World journal of diabetes, 4(4), 114.
- McCarthy M. & Zeggini E., (2009), Genome-wide association studies in type 2 diabetes, Review-Curr Diab Rep. 2009 Apr;9(2):164-71.
- Song, Y., Niu, T., Manson, J. E., Kwiatkowski, D. J., & Liu, S. (2004). Are variants in the CAPN10 gene related to risk of type 2 diabetes? A quantitative assessment of population and family-based association studies. The American Journal of Human Genetics, 74(2), 208-222.
- Jirtle, R. L., & Skinner, M. K. (2007). Environmental epigenomics and disease susceptibility. Nature reviews genetics, 8(4), 253-262.
- Zhang, X., & Ho, S. M. (2011). Epigenetics meets endocrinology. Journal of molecular endocrinology, 46(1), R11.
- Feinberg A.P., (2007), Phenotypic plasticity and the epigenetics of human disease, Review-Nature. 2007 May 24;447(7143):433-40.
- Gabory, A., Attig, L., &Junien, C. (2011). Epigenetic mechanisms involved in developmental nutritional programming. World journal of Diabetes, 2(10), 164.
- Lips, P., & Van Schoor, N. M. (2011). The effect of vitamin D on bone and osteoporosis. Best practice & research Clinical endocrinology & metabolism, 25(4), 585-591.
- https://onlinelibrary.wiley.com/doi/abs/10.1111/jcpt.12026
- ICMR. (2006). Ethical Guidelines for Biomedical research on Human Participants. New Delhi: Indian Council of Medical Research. [cited 2012 Jul 24]. Available from: http://icmr.nic.in/ethical_guidelines.pdf
- Munnangi, S., &Boktor, S. W. (2017). Epidemiology of study design.
- Chapuy, M. C., Preziosi, P., Maamer, M., Arnaud, S., Galan, P., Hercberg, S., & Meunier, P. J. (1997). Prevalence of vitamin D insufficiency in an adult normal population. Osteoporosis international, 7(5), 439-443.https://doi.org/10.1007/s00198-020-05495-w
- Lips, P. (2004). Which circulating level of 25-hydroxyvitamin D is appropriate? The Journal of steroid biochemistry and molecular biology, 89, 611-614.
- Dawson-Hughes, B., Heaney, R. P., Holick, M. F., Lips, P., Meunier, P. J., &Vieth, R. (2005). Estimates of optimal vitamin D status. Osteoporos Int. 2005 Jul;16(7):713-6
- Holick, M.F. The vitamin D deficiency pandemic: Approaches for diagnosis, treatment and prevention. Rev. Endocr. Metab. Disord. 2017, 18, 153–165. [Google Scholar] [CrossRef] [PubMed]
- Subramanian A., Nigam P., Misra A., Pandey R.M., Mathur M., Gupta R., Madhusudan S., (2011), Severe vitamin D deficiency in patients with Type 2 diabetes in north India, Diabetes Manage. (2011) 1(5), 477–483.
- Swinscow T.D.V., 1997, Statistics at Square One, Ninth Edition, Revised by M J Campbell, University of Southampton, Copyright BMJ Publishing Group 1997
- Webb, A. R., Kline, L., &Holick, M. F. (1988). Influence of season and latitude on the cutaneous synthesis of vitamin D3: exposure to winter sunlight in Boston and Edmonton will not promote vitamin D3 synthesis in human skin. The journal of clinical endocrinology & metabolism, 67(2), 373-378.
- Webb, A. R., &Engelsen, O. (2014). Ultraviolet exposure scenarios: risks of erythema from recommendations on cutaneous vitamin D synthesis. Advances in experimental medicine and biology, 810, 406-422.
- Harinarayan, C. V., Holick, M. F., Prasad, U. V., Vani, P. S., &Himabindu, G. (2013). Vitamin D status and sun exposure in India. Dermato-endocrinology, 5(1), 130-141.
- van Schoor NM, Lips P., (2011) Worldwide Vitamin D status. Best Pract Res Clin Endocrinol Metab. 2011; 25:671–80.
- Mithal A, Wahl DA, Bonjour JP, Burckhardt P, Dawson-Hughes B, Eisman JA, et al. Global Vitamin D status and determinants of hypovitaminosis D. Osteoporos Int. 2009;20:1807–20.
- Aparna P., Muthahtal S., Nongkynrih B., & Gupta S.K., (2018), Vitamin D deficiency in India, J Family Med Prim Care., 2018 Mar-Apr; 7(2): 324–330.
- Saha S, Goswami R, Ramakrishnan L, Vishnubhatla S, Mahtab S, Kar P, Srinivasan S., Singh N., Singh U., (2018), Vitamin D and calcium supplementation, skeletal muscle strength and serum testosterone in young healthy adult males: Randomized control trial. Clin Endocrinol (Oxf) 2018; 88:217–26
- Goswami R. & Nair A., (2019), Diabetes mellitus, vitamin D & osteoporosis: Insights Indian J Med Res., 2019 Nov; 150(5): 425–428.
- Harinarayan CV & Akhila H. (2019), Modern India and the Tale of Twin Nutrient Deficiency-Calcium and Vitamin D-Nutrition Trend Data 50 Years-Retrospect, Introspect, and Prospect. Front Endocrinol (Lausanne). 2019 Aug 9; 10:493. doi: 10.3389/fendo.2019.00493. PMID: 31447775; PMCID: PMC6696513.
- Patwardhan V.G., Mugal Z.M., Chiplonkar S.A., Webb A.R., Kift R., Khadilkar V.V., Padidela R., & Khadilkar A.V., (2018), Duration of Casual Sunlight Exposure Necessary for Adequate Vitamin D Status in Indian Men, Indian J Endocrinol Metab., 2018 Mar-Apr; 22(2): 249–255.